Crop production geography
Map modeled crop production and harvested area, with country context and rainfall comparisons.
Global geographic overview
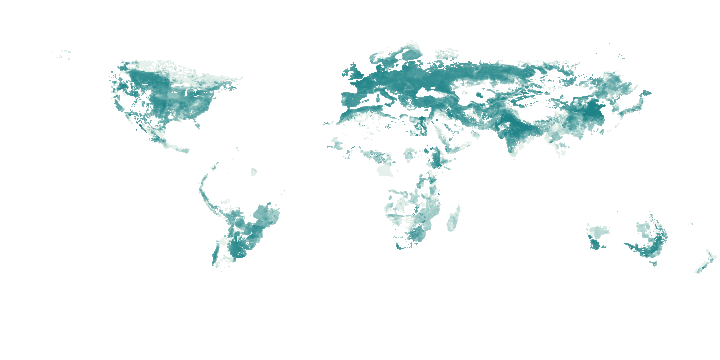
Light to dark green: increasing tonnes; logarithmic display, with high values capped for colour only. Select a point to inspect its retained grid value.
This global overview is independent of the country table filters below.
Sum of available native 5-arc-minute cells in each 0.5° display cell; missing cells are excluded.
Canada: 24 retained records. The table below shows the first 100.
Mapped sites use publisher coordinates. Records without site coordinates use a country label point when available; those points are not facility or event locations. Multiple records can share a point.
Select a mapped point to inspect its name and source.
| Name / document | Modeled production · tonnes | Harvested area · ha | Reference year | Rainfall · mm | Reference rainfall · mm | Rainfall vs reference · % | Production weight with rain · % | Source |
|---|---|---|---|---|---|---|---|---|
| Wheat | 30,110,621.3913 | 9,632,344.743 | 2,020 | 31.4206 | 31.7679 | -1.0935 | 100 | Original record |
| Maize | 13,623,264.1227 | 1,412,586.0333 | 2,020 | 57.907 | 76.2141 | -24.0207 | 100 | Original record |
| Barley | 9,299,899.6798 | 2,839,709.2638 | 2,020 | 22.1888 | 30.4076 | -27.0287 | 100 | Original record |
| Sorghum | 16.0431 | 2.7099 | 2,020 | 53.105 | 72.5637 | -26.8159 | 100 | Original record |
| Other Cereals | 4,691,285.8507 | 1,568,105.6762 | 2,020 | 38.536 | 33.8921 | 13.7018 | 100 | Original record |
| Potato | 5,530,473.5515 | 141,246.5441 | 2,020 | 40.9867 | 69.5493 | -41.0682 | 100 | Original record |
| Sweet Potato | 1.5171 | 0.0599 | 2,020 | 57.1872 | 83.3489 | -31.3882 | 100 | Original record |
| Bean | 397,229.0902 | 167,860.0839 | 2,020 | 51.905 | 52.5706 | -1.2661 | 100 | Original record |
| Chickpea | 180,725.1004 | 116,433.9009 | 2,020 | 26.1405 | 17.6754 | 47.892 | 100 | Original record |
| Lentil | 2,285,346.8982 | 1,636,451.9053 | 2,020 | 21.7214 | 21.9934 | -1.2365 | 100 | Original record |
| Other Pulses | 3,695,645.3986 | 1,628,565.8021 | 2,020 | 27.0222 | 27.6245 | -2.1805 | 100 | Original record |
| Soybean | 6,243,800.8902 | 2,141,290.7365 | 2,020 | 58.1676 | 70.9196 | -17.981 | 100 | Original record |
| Sunflower | 81,962.5641 | 38,009.349 | 2,020 | 60.4195 | 32.818 | 84.1044 | 100 | Original record |
| Rapeseed | 17,810,874.9164 | 8,701,626.5949 | 2,020 | 32.6742 | 26.0405 | 25.4746 | 100 | Original record |
| Other Oil Crops | 488,684.9001 | 428,852.8999 | 2,020 | 36.1559 | 22.5939 | 60.025 | 100 | Original record |
| Sugarbeet | 1,148,261.5371 | 15,377.445 | 2,020 | 24.4581 | 45.6636 | -46.4386 | 100 | Original record |
| Other Fibre Crops | 27,810.8 | 21,000.5 | 2,020 | 26.02 | 33.3357 | -21.9455 | 100 | Original record |
| Tobacco | 27,786.8001 | 9,800.9 | 2,020 | 60.9466 | 81.5876 | -25.2991 | 100 | Original record |
| Other Tropical Fruit | 45,067.8147 | 1,110.7503 | 2,020 | 56.3512 | 78.9264 | -28.6028 | 100 | Original record |
| Temperate Fruit | 878,048.2201 | 83,974.4928 | 2,020 | 51.1843 | 81.6007 | -37.2747 | 100 | Original record |
| Tomato | 503,942.2537 | 5,994.2033 | 2,020 | 57.1259 | 78.5794 | -27.3017 | 100 | Original record |
| Onion | 244,452.6211 | 5,444.3069 | 2,020 | 49.5765 | 76.278 | -35.0056 | 100 | Original record |
| Other Vegetables | 1,523,155.0047 | 78,228.1129 | 2,020 | 53.2254 | 79.9307 | -33.4106 | 100 | Original record |
| Rest of Crops | 12,073.3 | 14,357.5 | 2,020 | 56.4112 | 80.3168 | -29.7641 | 100 | Original record |
Download country records (JSON) · Download complete explorer records (compressed CSV) · Coverage and definitions
Explore covered commodity suppliers and trade for this country →
Coverage and interpretation
IFPRI MapSPAM 2020 v2r2, distributed by CGIAR Climate Data Hub. CC BY 4.0; adapted. All 46 source crop bands retained separately. Production is metric tonnes, harvested area hectares; categories differ in water content and should not be ranked as food calories. Country assignments use native cell centres inside generalized Natural Earth 1:110m boundaries: border/coastal omissions are explicitly UNMATCHED, not official national totals. The 0.5° map sums available native 5-arc-minute cells. Rain is sampled from the native 0.1° IMERG cell at each crop-cell centre, weighted by modeled 2020 production. Both rain periods use identical valid crop cells; reference requires all five Septembers. Comparisons below 90% production coverage are unavailable. A five-year reference is not a climatological normal. This describes geography, not current crop output or predicted losses.
JSON downloads contain retained records for the selected country, including records outside the current filters. Complete-explorer CSV downloads contain all covered countries. New source snapshots are checked and reviewed separately before publication.
Source: Source attributions and adaptation details below. Source period: 2020 crop reference; rainfall September 2025 versus September 2020–2024. World Signal Monitor adapted the selection, navigation and maps; no publisher endorsement is implied. File checksums · Source URLs, retrieval dates and hashes