Satellite rainfall
Explore retained NASA IMERG monthly rainfall and an explicitly dated five-year comparison.
Global geographic overview
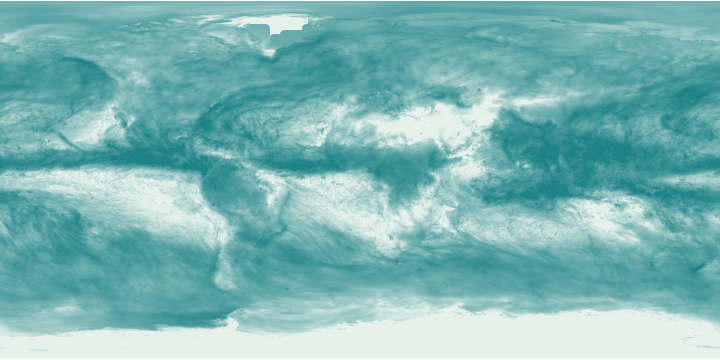
Light to dark green: increasing mm; logarithmic display, with high values capped for colour only. Select a point to inspect its retained grid value.
This global overview is independent of the country table filters below.
Arithmetic mean of available 0.1° source cells within each 0.5° display cell.
Canada: 2 retained records. The table below shows the first 100.
Mapped sites use publisher coordinates. Records without site coordinates use a country label point when available; those points are not facility or event locations. Multiple records can share a point.
Select a mapped point to inspect its name and source.
| Name / document | Rainfall · mm | Available display cells | Reference year | Source |
|---|---|---|---|---|
| September 2025 | 43.8029 | 5,769 | 2025-09 | Original record |
| September 2020–2024 mean | 52.3405 | 5,769 | 2020–2024 September | Original record |
Download country records (JSON) · Download complete explorer records (compressed CSV) · Coverage and definitions
Explore covered commodity suppliers and trade for this country →
Coverage and interpretation
NASA GPM IMERG monthly accumulated precipitation, distributed by University of South Florida IMaRS ERDDAP; freely reusable with source acknowledgment. Native 0.1° data retained. Maps average available cells to 0.5°, without turning missing values into zero. Tables average displayed cells whose centres intersect generalized country boundaries; these are descriptive samples, not area-weighted national rainfall or totals. Reference requires all five source months, is not a 30-year climatology and is not a live weather feed.
JSON downloads contain retained records for the selected country, including records outside the current filters. Complete-explorer CSV downloads contain all covered countries. New source snapshots are checked and reviewed separately before publication.
Source: Source attributions and adaptation details below. Source period: September 2025 and the five Septembers 2020–2024. World Signal Monitor adapted the selection, navigation and maps; no publisher endorsement is implied. File checksums · Source URLs, retrieval dates and hashes