Satellite soil moisture
Inspect dated SMAP surface-soil-moisture maps alongside crop geography.
Global geographic overview
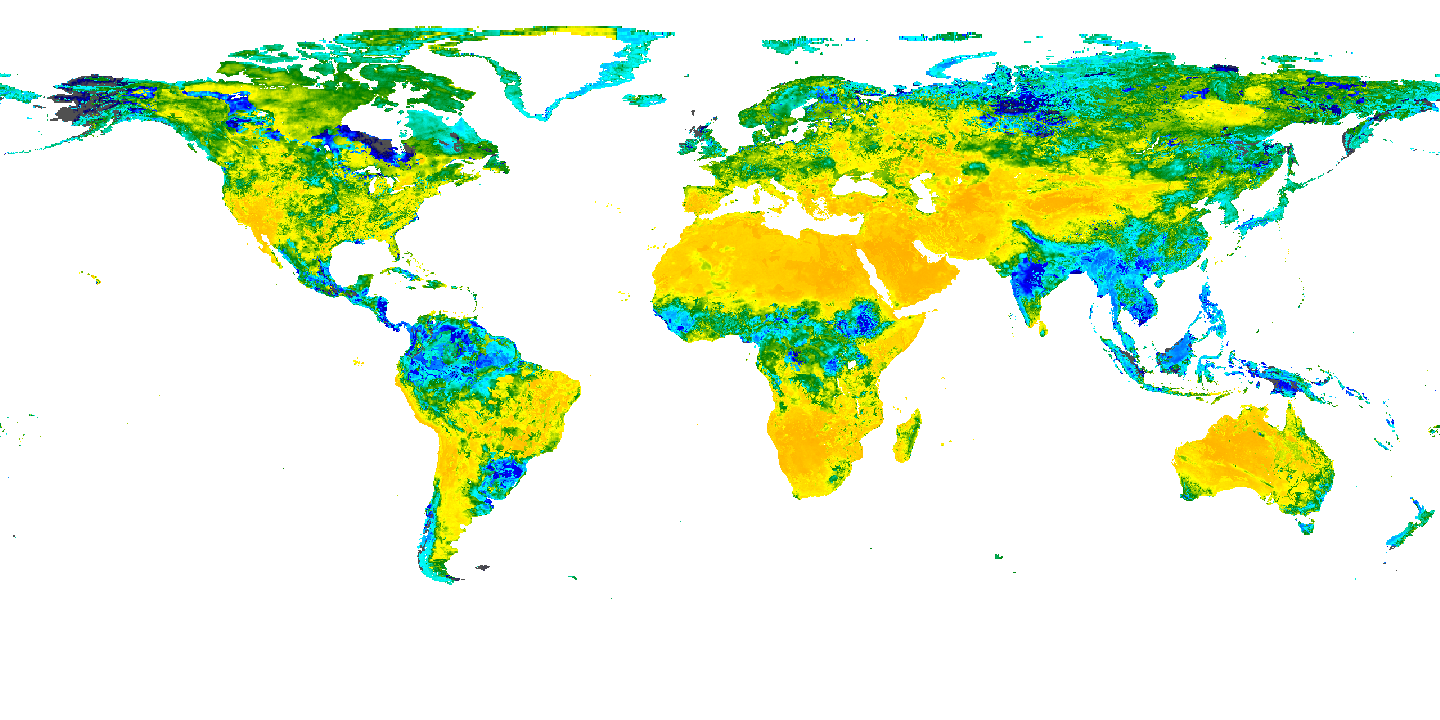
NASA colour scale · volumetric m³/m³: 0  0.7 and above. Transparent areas have no displayed value. Exact publisher colour mapping. Display colours are not used to calculate exposure.
This global overview is independent of the country table filters below.
Exact NASA GIBS rendered global snapshot, 12 UTC. No quantitative values are recovered from display colours.
GLOBAL: 2 retained records. The table below shows the first 100.
Mapped sites use publisher coordinates. Records without site coordinates use a country label point when available; those points are not facility or event locations. Multiple records can share a point.
Select a mapped point to inspect its name and source.
| Name / document | Observation date | Source product | Unit | Nontransparent display pixels | Source |
|---|---|---|---|---|---|
| Surface soil moisture · 2025-09-15 | 2025-09-15 | SMAP L4 surface, 12 UTC | m³/m³ | 253,600 | Original record |
| Surface soil moisture · 2026-10-20 | 2026-10-20 | SMAP L4 surface, 12 UTC | m³/m³ | 253,600 | Original record |
Download country records (JSON) · Download complete explorer records (compressed CSV) · Coverage and definitions
Explore covered commodity suppliers and trade for this country →
Coverage and interpretation
NASA SMAP L4 model value-added surface soil moisture, rendered by NASA GIBS in geographic coordinates. NASA acknowledgment; no endorsement. Exact publisher-rendered PNG snapshots at 0.25° display sampling; the underlying model grid is 9 km. Values are volumetric m³/m³. Model estimates combine satellite information and modeling; these are not station measurements. Map colours are visual context only: no soil-moisture numbers, anomalies or crop-loss estimates are reverse-engineered from pixels. No-data remains transparent. Dates differ from rainfall and historical crop production.
JSON downloads contain retained records for the selected country, including records outside the current filters. Complete-explorer CSV downloads contain all covered countries. New source snapshots are checked and reviewed separately before publication.
Source: Source attributions and adaptation details below. Source period: 15 September 2025 and 20 October 2026, 12 UTC. World Signal Monitor adapted the selection, navigation and maps; no publisher endorsement is implied. File checksums · Source URLs, retrieval dates and hashes