Silver: the leading trade routes
China → Hong Kong is the largest retained route. Displayed routes cover 53.7% of primary-line world trade.
Swipe the diagram sideways to see all labels, or download the full image.
How to read this diagram
Ribbon widths represent USD value for the 15 retained leading exporter–importer routes. These represent 53.7% of primary-line world value (2304 total corridors). Node totals cover displayed routes only.
Selected primary HS line only, not all silver products or physical tonnage. Reporting year 2024; snapshot generated 2026-10-10. Acquisition date is not supplied.
Other routes are omitted. The data export contains exactly the displayed routes; broader commodity coverage is in the linked retained snapshot.
Explore the source dataset →The data behind the picture
15 retained routes · Reporting year 2024 · Unit: USD. Numeric strings below retain snapshot precision.
| Exporter | Importer | Year | Value (USD) | Share of world primary-line trade (%) | Source status / note | Evidence |
|---|---|---|---|---|---|---|
| China CHN | Hong Kong | 2024 | 3183095079.0000005 | 9.50012847428217 | Retained derived corridor value | Source/publisher-data/patterns/trade-flows.json · silver · CHN → HKG |
| Mexico MEX | United States | 2024 | 2590566619.0000005 | 7.731693553250217 | Retained derived corridor value | Source/publisher-data/patterns/trade-flows.json · silver · MEX → USA |
| United Kingdom GBR | India | 2024 | 2353699494 | 7.024750134035481 | Retained derived corridor value | Source/publisher-data/patterns/trade-flows.json · silver · GBR → IND |
| United Arab Emirates ARE | India | 2024 | 1971900862 | 5.885250381346763 | Retained derived corridor value | Source/publisher-data/patterns/trade-flows.json · silver · ARE → IND |
| China CHN | United Kingdom | 2024 | 1523898924 | 4.548163093000829 | Retained derived corridor value | Source/publisher-data/patterns/trade-flows.json · silver · CHN → GBR |
| Canada CAN | United States | 2024 | 1148938070 | 3.429071078022235 | Retained derived corridor value | Source/publisher-data/patterns/trade-flows.json · silver · CAN → USA |
| South Korea KOR | Japan | 2024 | 926985538 | 2.7666411106916153 | Retained derived corridor value | Source/publisher-data/patterns/trade-flows.json · silver · KOR → JPN |
| Japan JPN | China | 2024 | 904622935 | 2.699898648953366 | Retained derived corridor value | Source/publisher-data/patterns/trade-flows.json · silver · JPN → CHN |
| Germany DEU | United Kingdom | 2024 | 833297612.0000001 | 2.4870241619674016 | Retained derived corridor value | Source/publisher-data/patterns/trade-flows.json · silver · DEU → GBR |
| United Kingdom GBR | United Arab Emirates | 2024 | 492490763.99999994 | 1.4698667222555117 | Retained derived corridor value | Source/publisher-data/patterns/trade-flows.json · silver · GBR → ARE |
| Poland POL | United Kingdom | 2024 | 472556091 | 1.410370555822337 | Retained derived corridor value | Source/publisher-data/patterns/trade-flows.json · silver · POL → GBR |
| Switzerland CHE | United Kingdom | 2024 | 434886603 | 1.297943824393109 | Retained derived corridor value | Source/publisher-data/patterns/trade-flows.json · silver · CHE → GBR |
| South Korea KOR | Hong Kong | 2024 | 408658547.99999994 | 1.2196647011038295 | Retained derived corridor value | Source/publisher-data/patterns/trade-flows.json · silver · KOR → HKG |
| Russia RUS | Armenia | 2024 | 389658790.00000006 | 1.1629588417121035 | Retained derived corridor value | Source/publisher-data/patterns/trade-flows.json · silver · RUS → ARM |
| United States USA | Canada | 2024 | 366229454.99999994 | 1.093032657591671 | Retained derived corridor value | Source/publisher-data/patterns/trade-flows.json · silver · USA → CAN |
Sources and attribution
CEPII BACI; derived primary-HS-line corridor snapshot from Commodity Origins.
Original publisher data · Source reuse terms and attribution
Retrieved: Not supplied by the retained derived snapshot. Vintage: 2026-10-10T22:48:06.733043+00:00.
Retained corridor snapshot · JSON
Diagram and editorial selection by World Signal Monitor. Display labels may be rounded; calculations and downloads use the retained values.
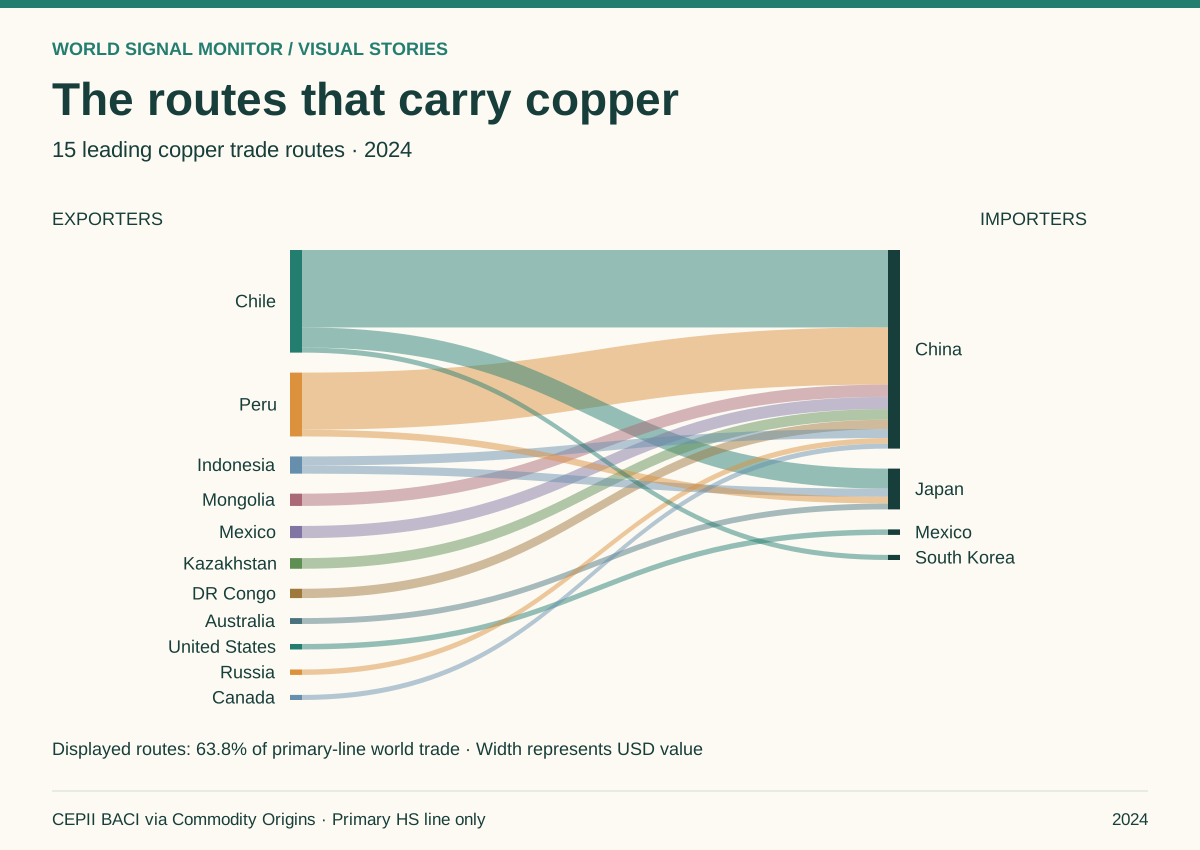 The routes that carry copper
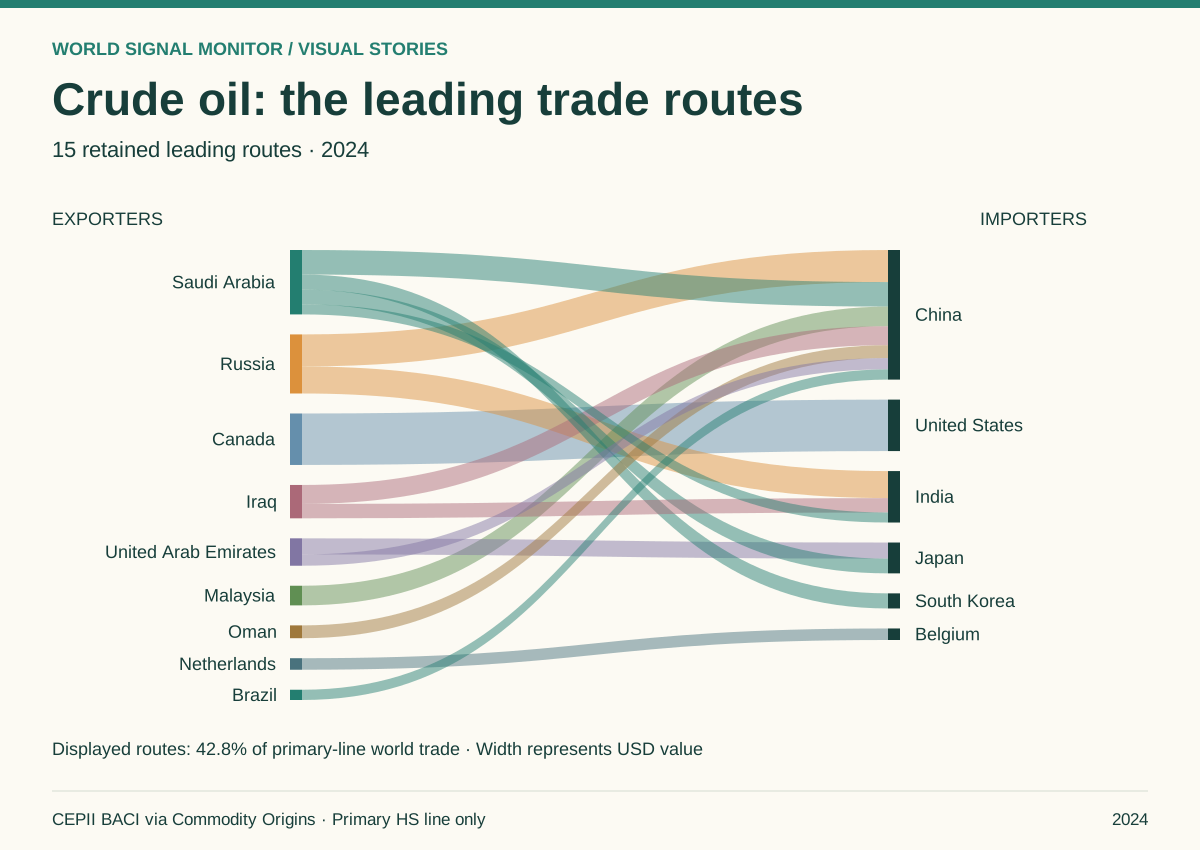 Crude oil: the leading trade routes
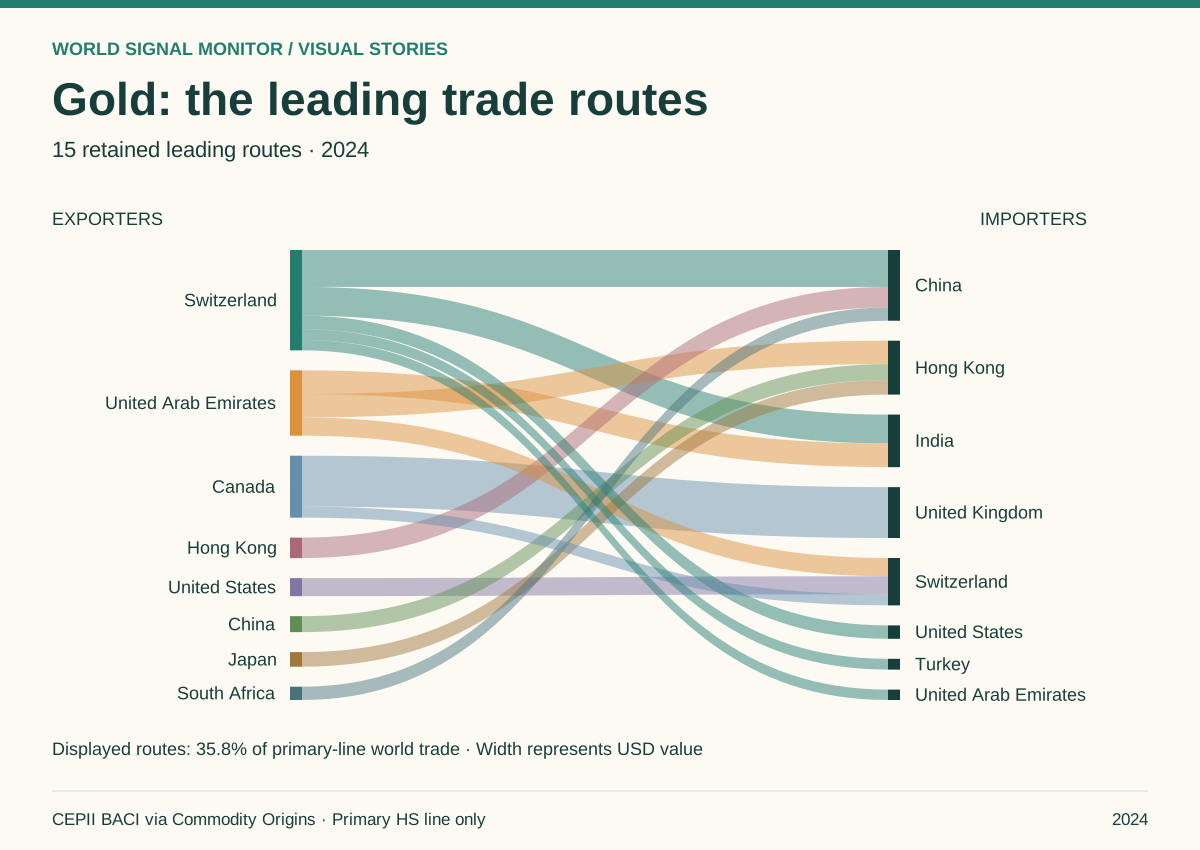 Gold: the leading trade routes