Crop conditions and the countries supplying them
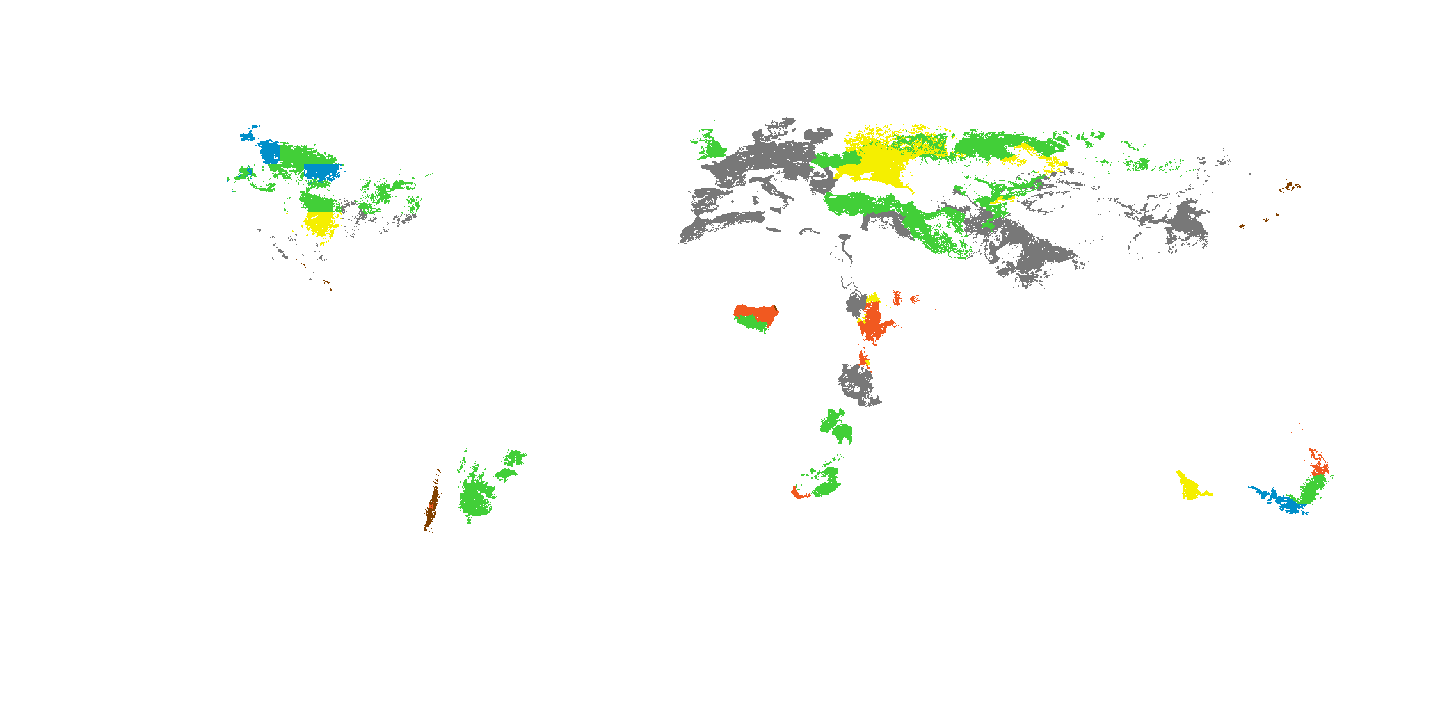
Explore regional crop assessments for wheat, maize, rice and soybeans, alongside separately dated export markets. See where crop conditions deserve a closer look.
Crop assessment: 2026-09-28. Export comparison: 2024, HS 1001.
Conditions describe the crop in its growing region relative to the publisher’s five-year reference. Drought is one possible pressure; this is not a drought-only map. Regional colours are not converted into national yield losses, export forecasts or a probability of disruption.
Download retained crop map · Publisher raster layers · Classification method · Global drought context
Wheat exporters · 2024 · HS 1001
The 25 largest exporters by covered BACI trade value. These historical trade shares provide context for the map; shipment origins can be trading hubs.
| Exporter | Covered exports USD | Share of covered value | Profile |
|---|---|---|---|
| Russia | $9,058,680,221 | 15.8% | Country profile |
| Canada | $7,822,843,884 | 13.6% | Country profile |
| United States | $6,718,853,459 | 11.7% | Country profile |
| Australia | $5,665,247,355 | 9.9% | Country profile |
| Ukraine | $4,773,972,992 | 8.3% | Country profile |
| France | $4,209,790,718 | 7.3% | Country profile |
| Romania | $2,447,398,895 | 4.3% | Country profile |
| Argentina | $1,934,311,925 | 3.4% | Country profile |
| Germany | $1,804,780,176 | 3.1% | Country profile |
| Poland | $1,614,075,468 | 2.8% | Country profile |
| Bulgaria | $1,408,917,787 | 2.4% | Country profile |
| Lithuania | $1,212,679,855 | 2.1% | Country profile |
| Kazakhstan | $1,164,623,151 | 2.0% | Country profile |
| Czechia | $902,129,424 | 1.6% | Country profile |
| Latvia | $812,484,790 | 1.4% | Country profile |
| Hungary | $802,631,471 | 1.4% | Country profile |
| Brazil | $623,016,342 | 1.1% | Country profile |
| Türkiye | $599,652,424 | 1.0% | Country profile |
| Slovakia | $394,238,971 | 0.7% | Country profile |
| Uruguay | $345,152,621 | 0.6% | Country profile |
| Serbia | $330,038,029 | 0.6% | Country profile |
| Austria | $320,987,604 | 0.6% | Country profile |
| Moldova | $255,981,126 | 0.4% | Country profile |
| Greece | $247,752,179 | 0.4% | Country profile |
| United Arab Emirates | $209,652,211 | 0.4% | Country profile |
Explore importing countries’ supplier dependence →
Sources and adaptation
Crop maps: GEOGLAM Crop Monitor, coordinated by the University of Maryland and supported by NASA Harvest, CC BY 4.0. Changes: publisher raster rendered with country outlines and paired with a separate trade table. Publisher categories and colours are retained. Assessments reflect expert consensus and multiple pressures, not a measurement at every farm. Blank areas have no displayed crop assessment.
Trade: CEPII BACI, Etalab Open Licence 2.0, complete retained routes for the selected HS line. Source years remain separate from the crop assessment date. Country outlines: Natural Earth, public domain.