Useful numbers. A clearer picture.
Explore the economy, health, energy, food and trade through diagrams you can inspect, download and share. Every story includes its data, reporting period and original sources.
Showing all 126 diagrams
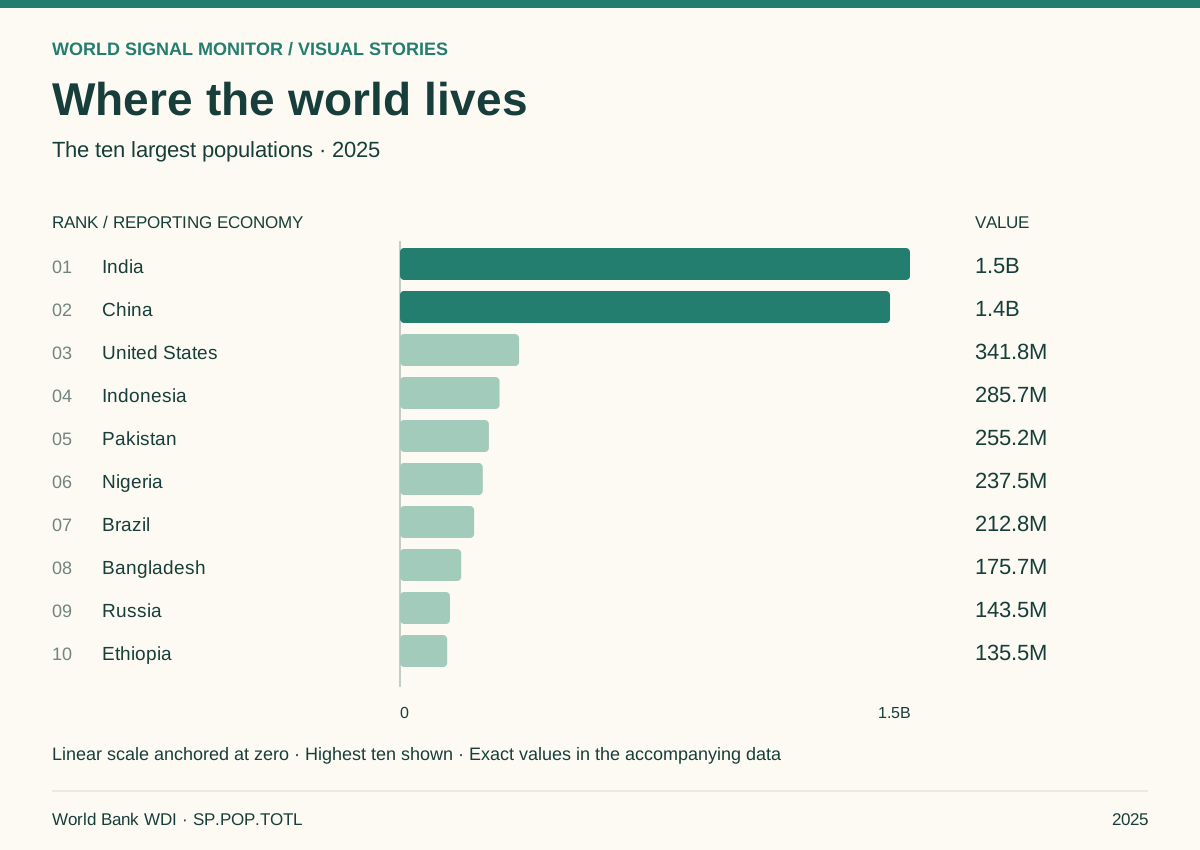
Where the world lives
India and China lead the population ranking.
Explore the story →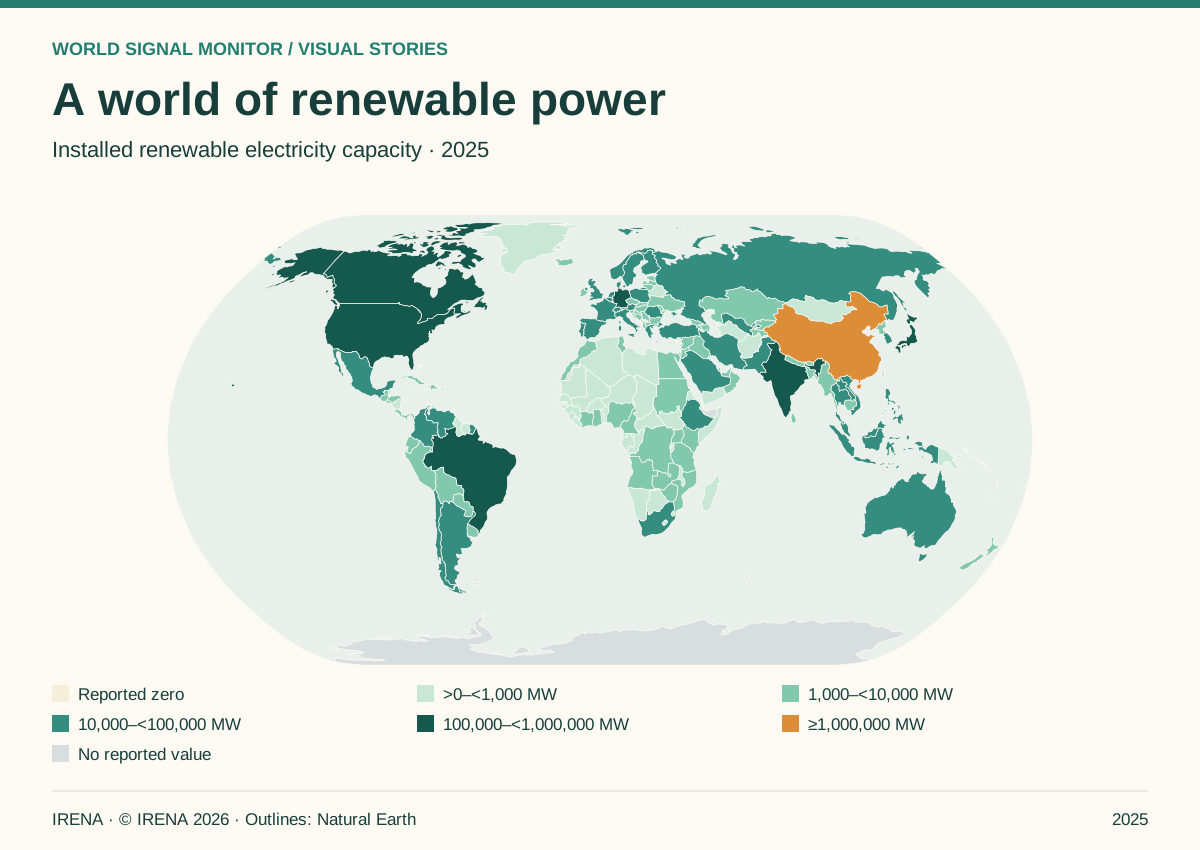
A world of renewable power
See where renewable generating capacity is installed.
Explore the story →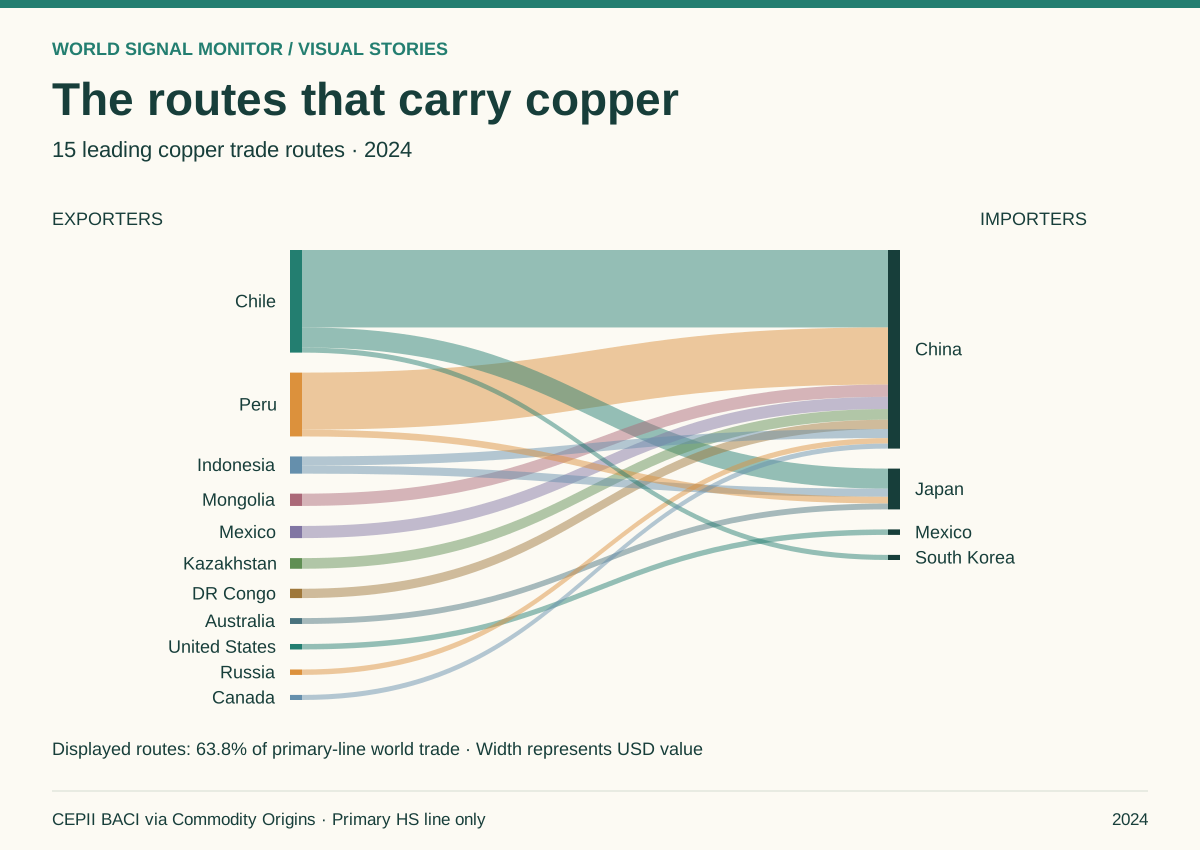
The routes that carry copper
Chile → China: $20.9B, the largest retained route.
Explore the story →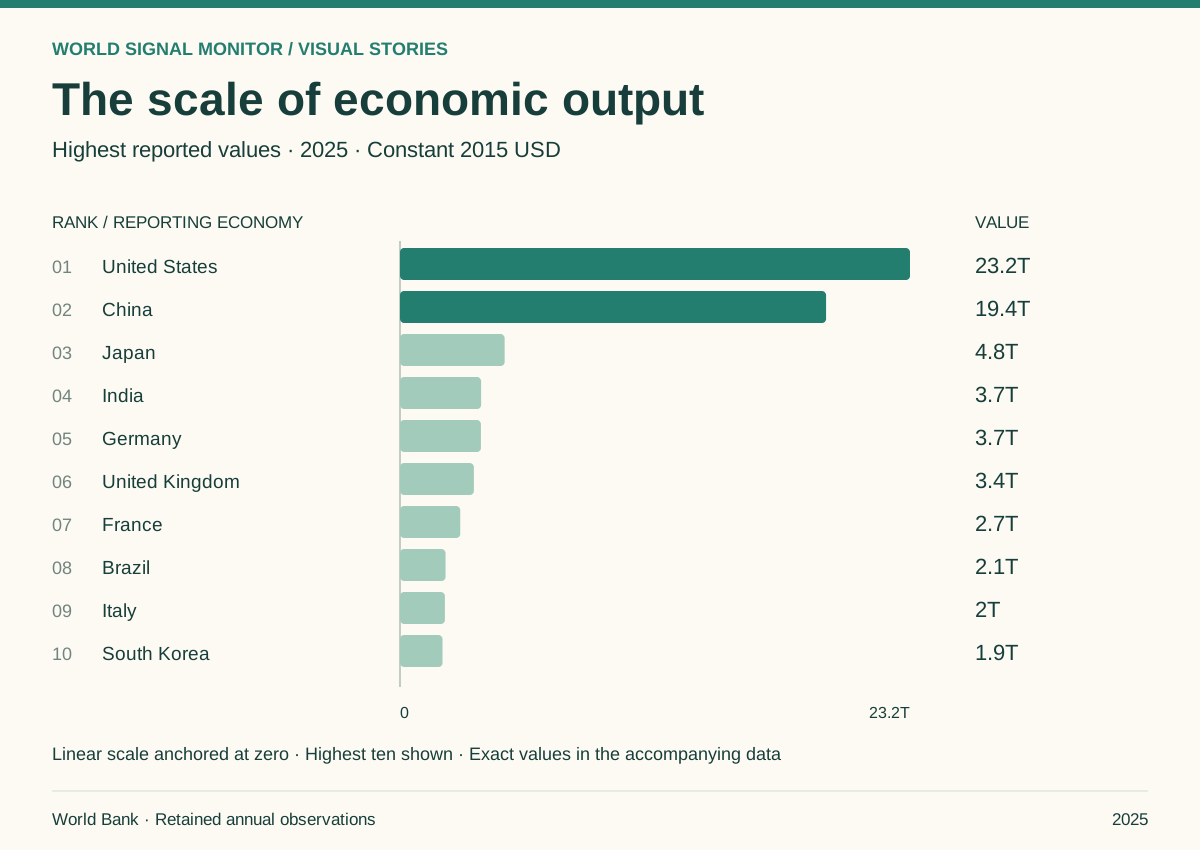
The scale of economic output
United States has the highest retained value for 2025. 186 of 217 reporting economies have a value in this comparison.
Explore the story →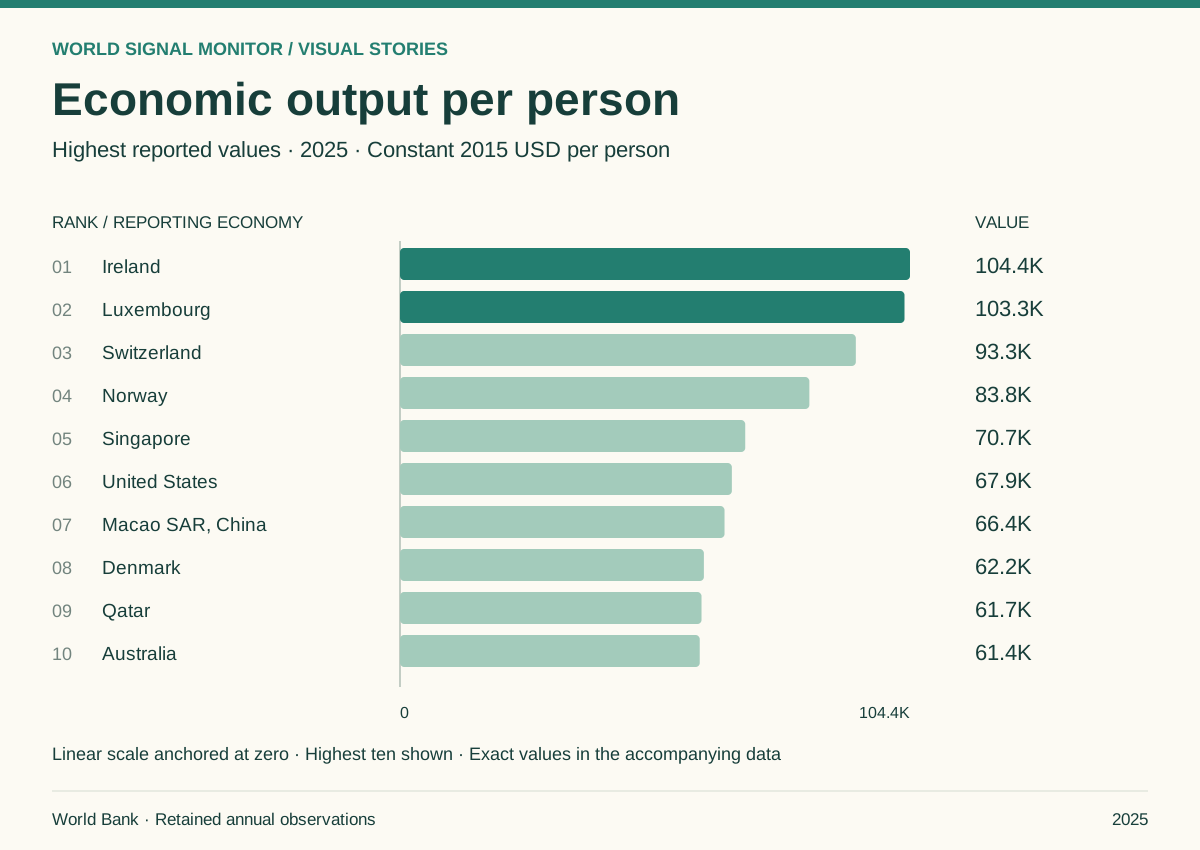
Economic output per person
Ireland has the highest retained value for 2025. 186 of 217 reporting economies have a value in this comparison.
Explore the story →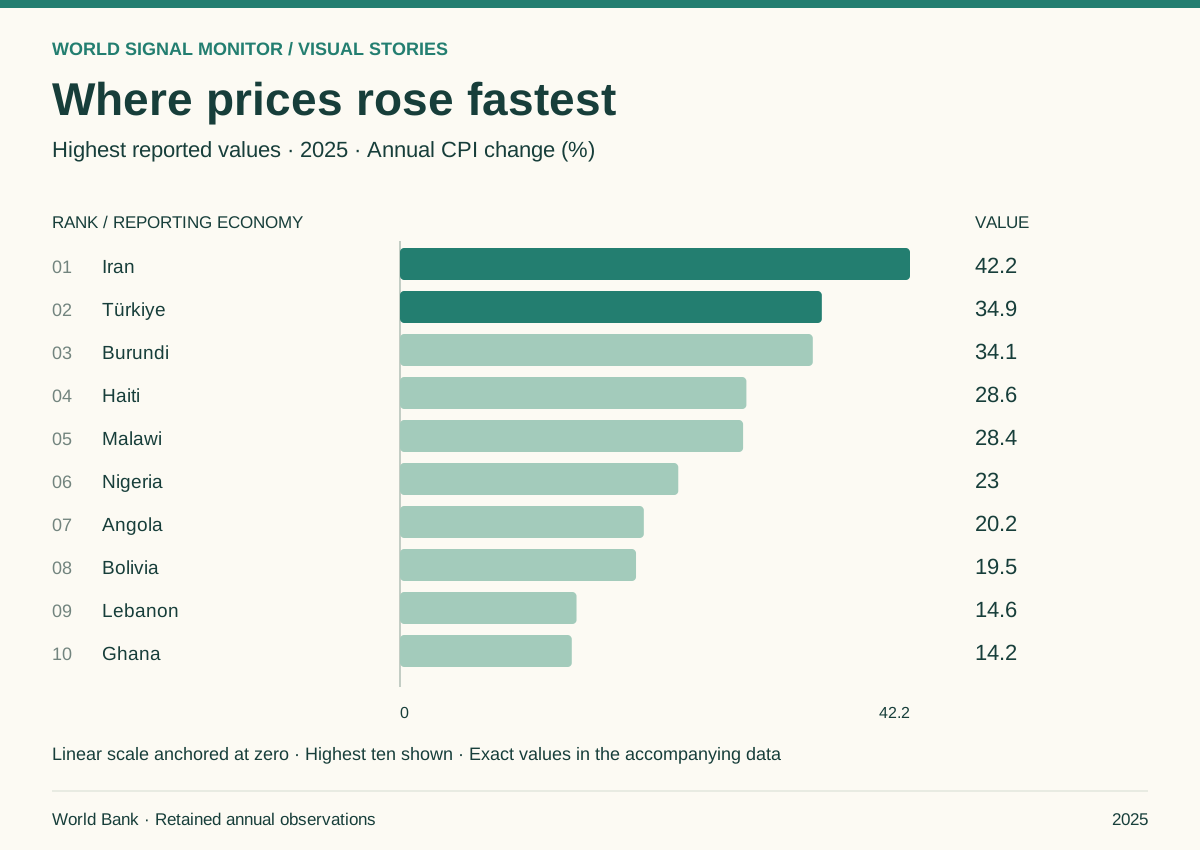
Where prices rose fastest
Iran has the highest retained value for 2025. 169 of 217 reporting economies have a value in this comparison.
Explore the story →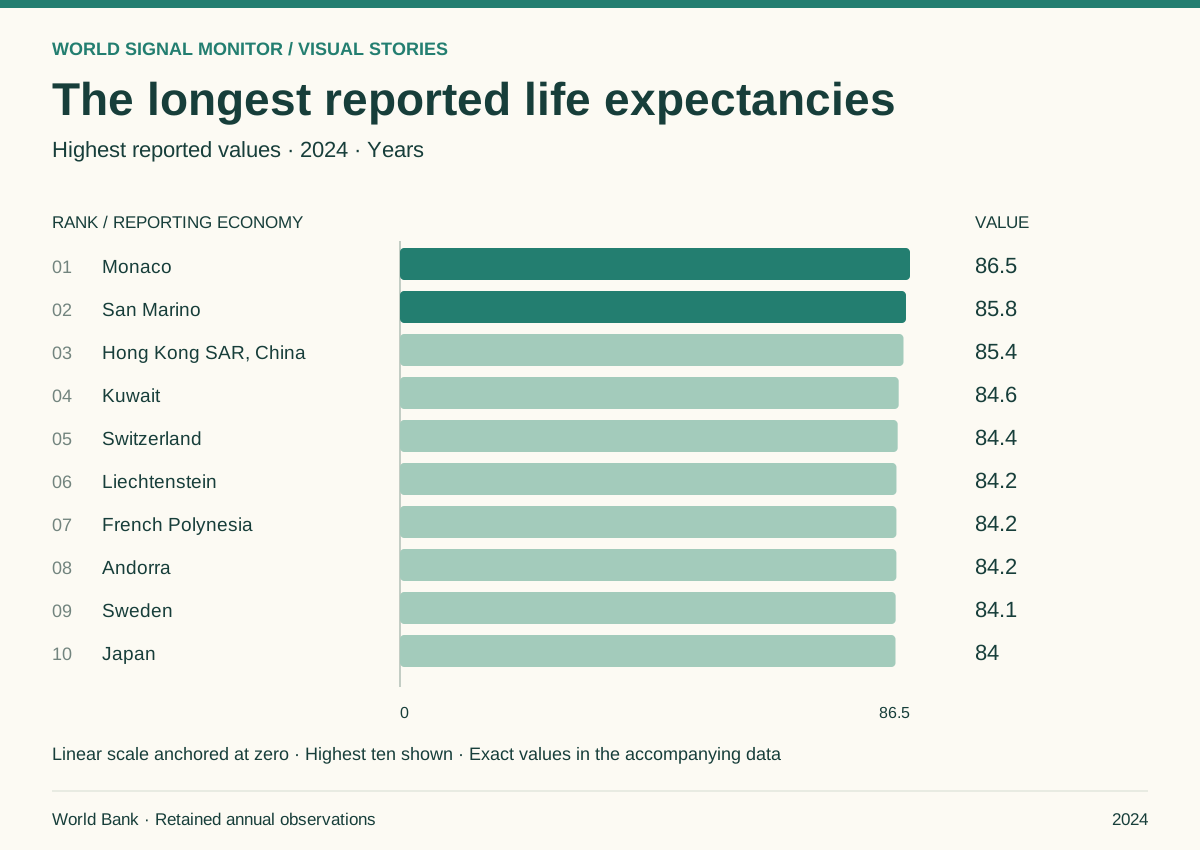
The longest reported life expectancies
Monaco has the highest retained value for 2024. 217 of 217 reporting economies have a value in this comparison.
Explore the story →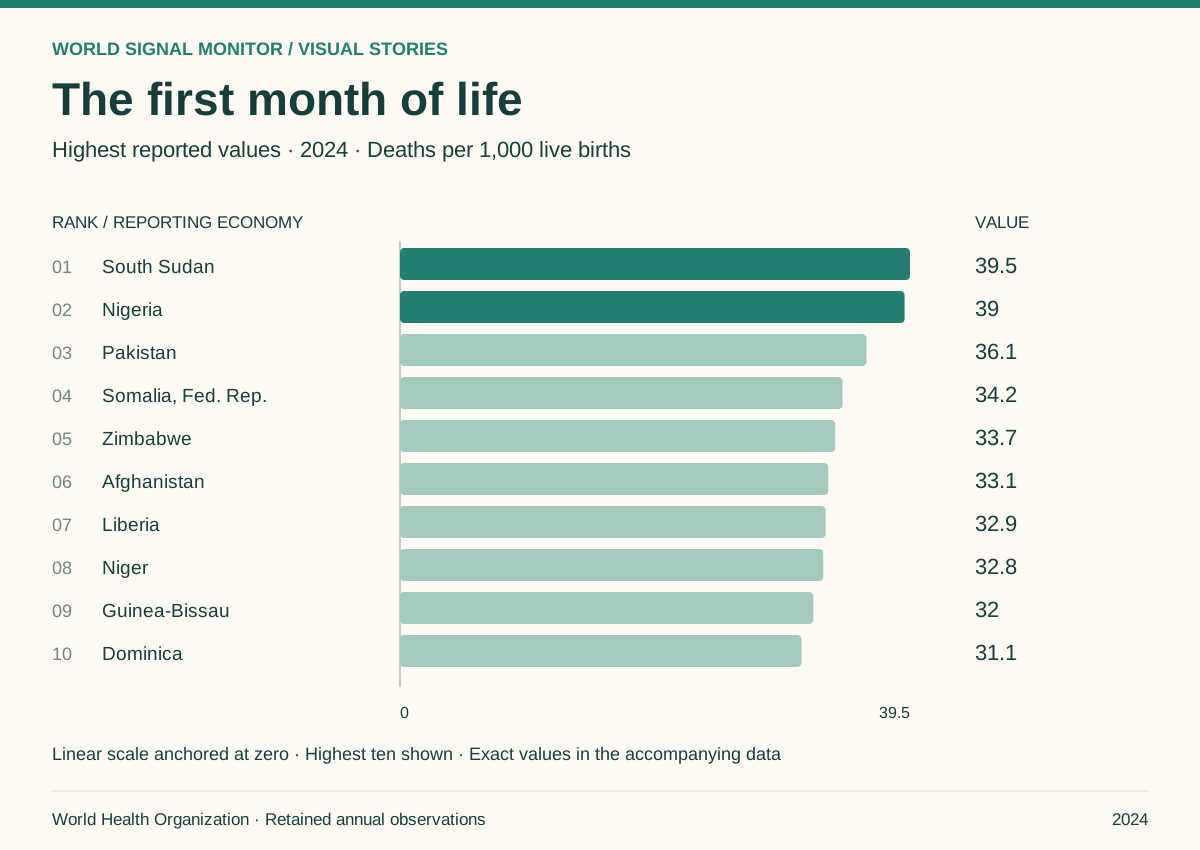
The first month of life
South Sudan has the highest retained value for 2024. 196 of 196 reporting economies have a value in this comparison.
Explore the story →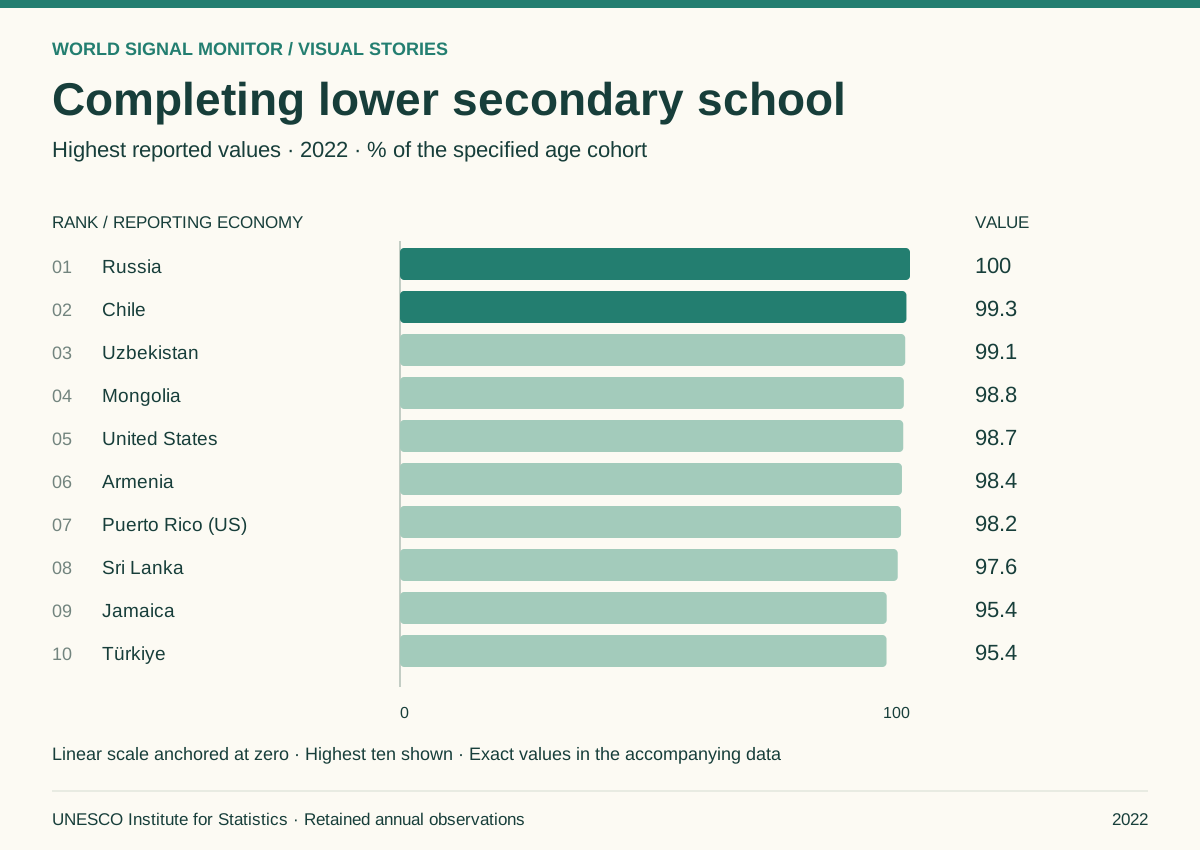
Completing lower secondary school
Russia has the highest retained value for 2022. 45 of 162 reporting economies have a value in this comparison.
Explore the story →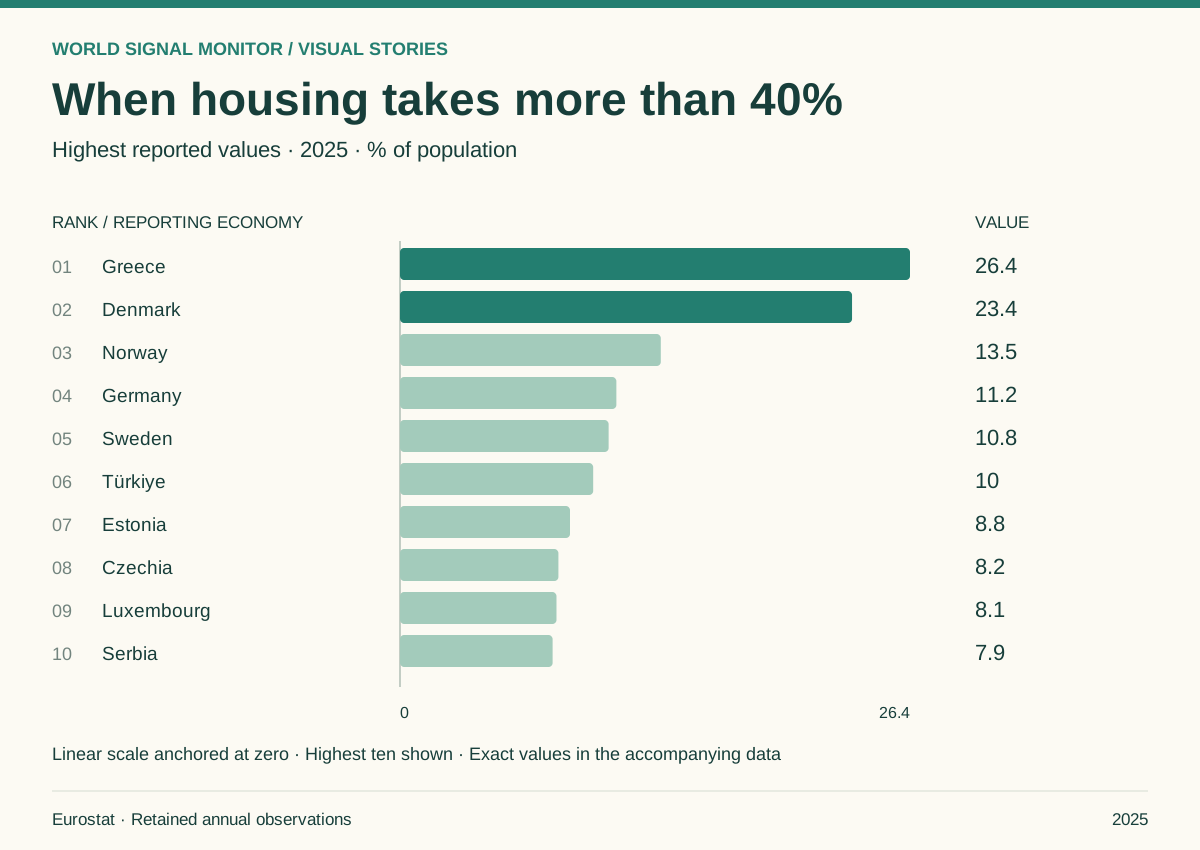
When housing takes more than 40%
Greece has the highest retained value for 2025. 30 of 35 reporting economies have a value in this comparison.
Explore the story →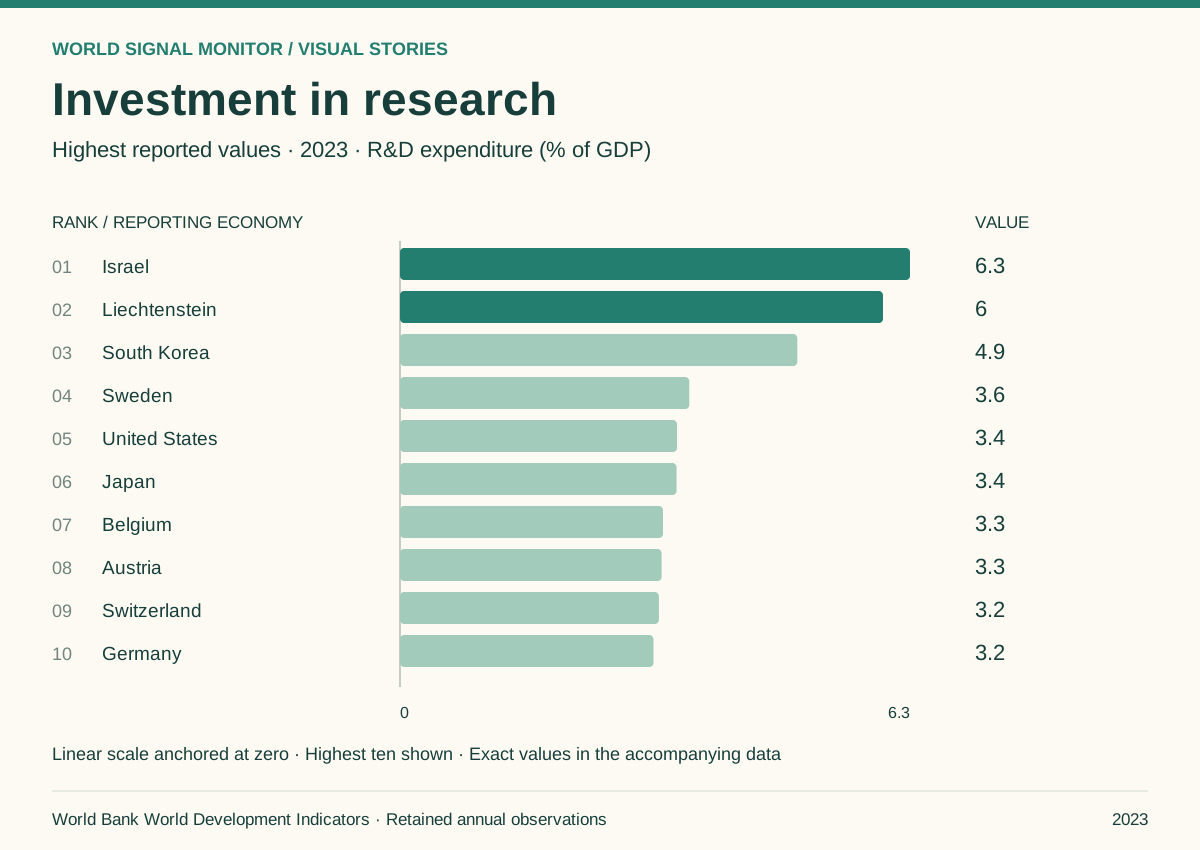
Investment in research
Israel has the highest retained value for 2023. 84 of 155 reporting economies have a value in this comparison.
Explore the story →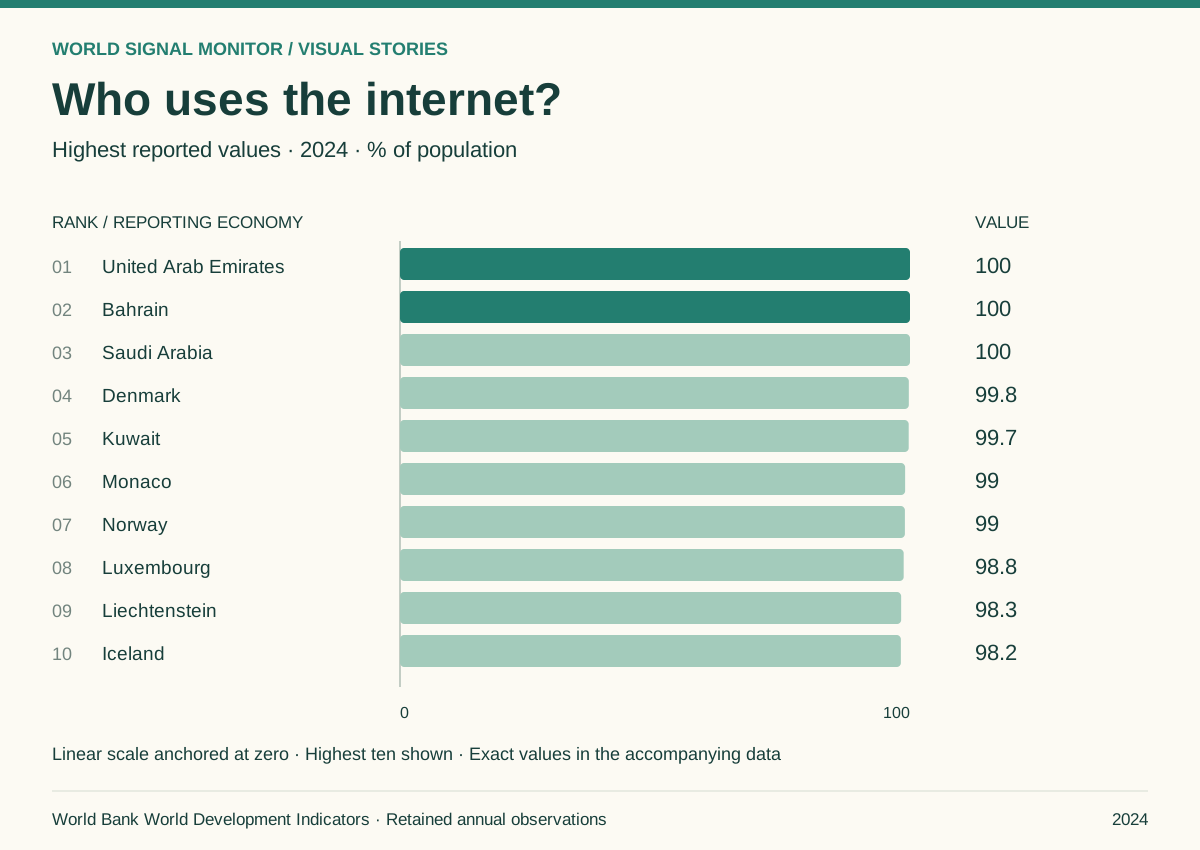
Who uses the internet?
United Arab Emirates has the highest retained value for 2024. 182 of 210 reporting economies have a value in this comparison.
Explore the story →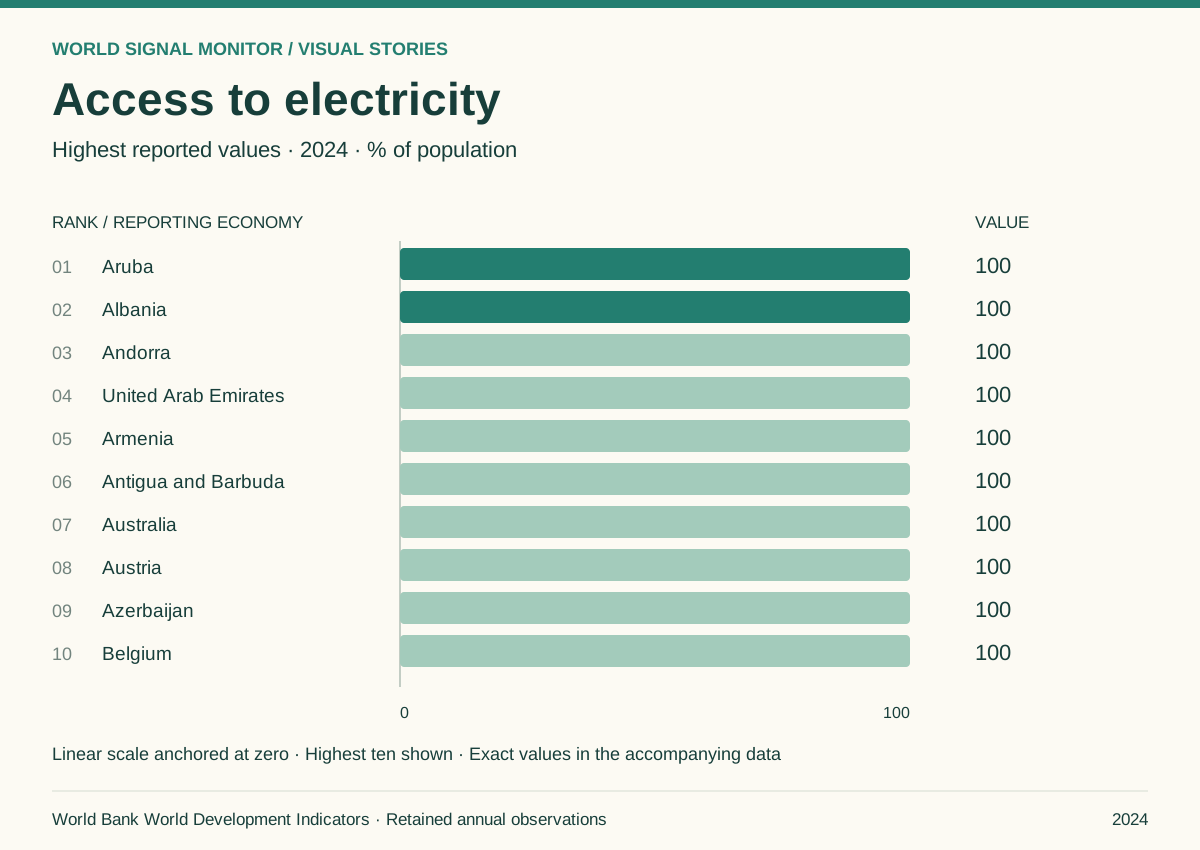
Access to electricity
Aruba has the highest retained value for 2024. 215 of 215 reporting economies have a value in this comparison.
Explore the story →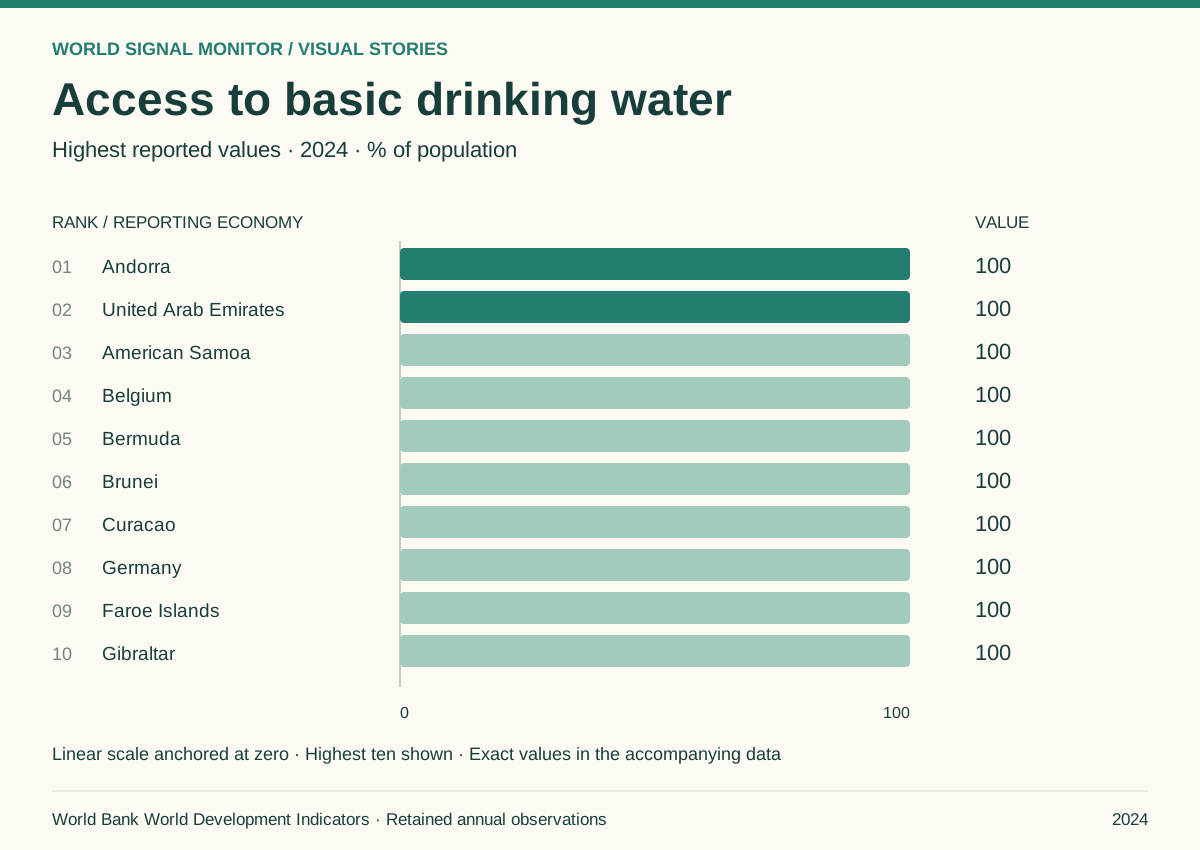
Access to basic drinking water
Andorra has the highest retained value for 2024. 202 of 214 reporting economies have a value in this comparison.
Explore the story →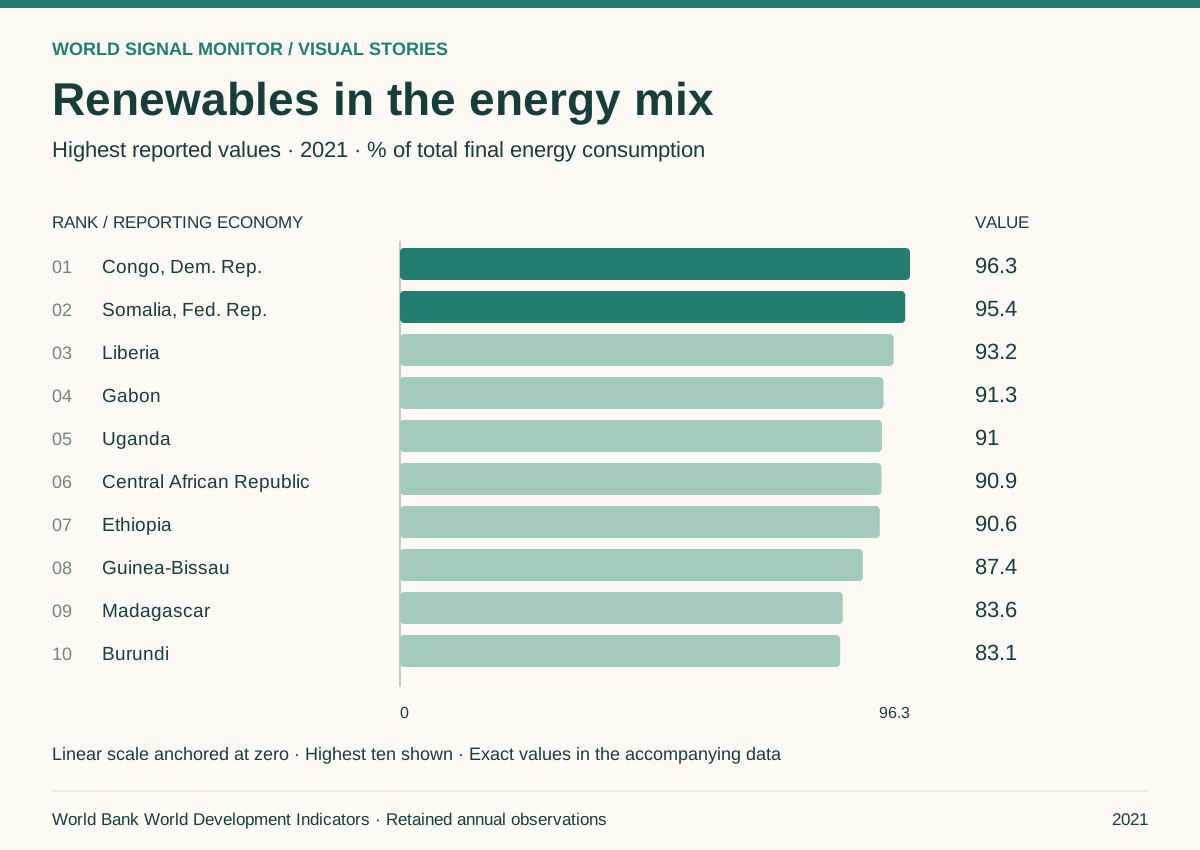
Renewables in the energy mix
Congo, Dem. Rep. has the highest retained value for 2021. 212 of 212 reporting economies have a value in this comparison.
Explore the story →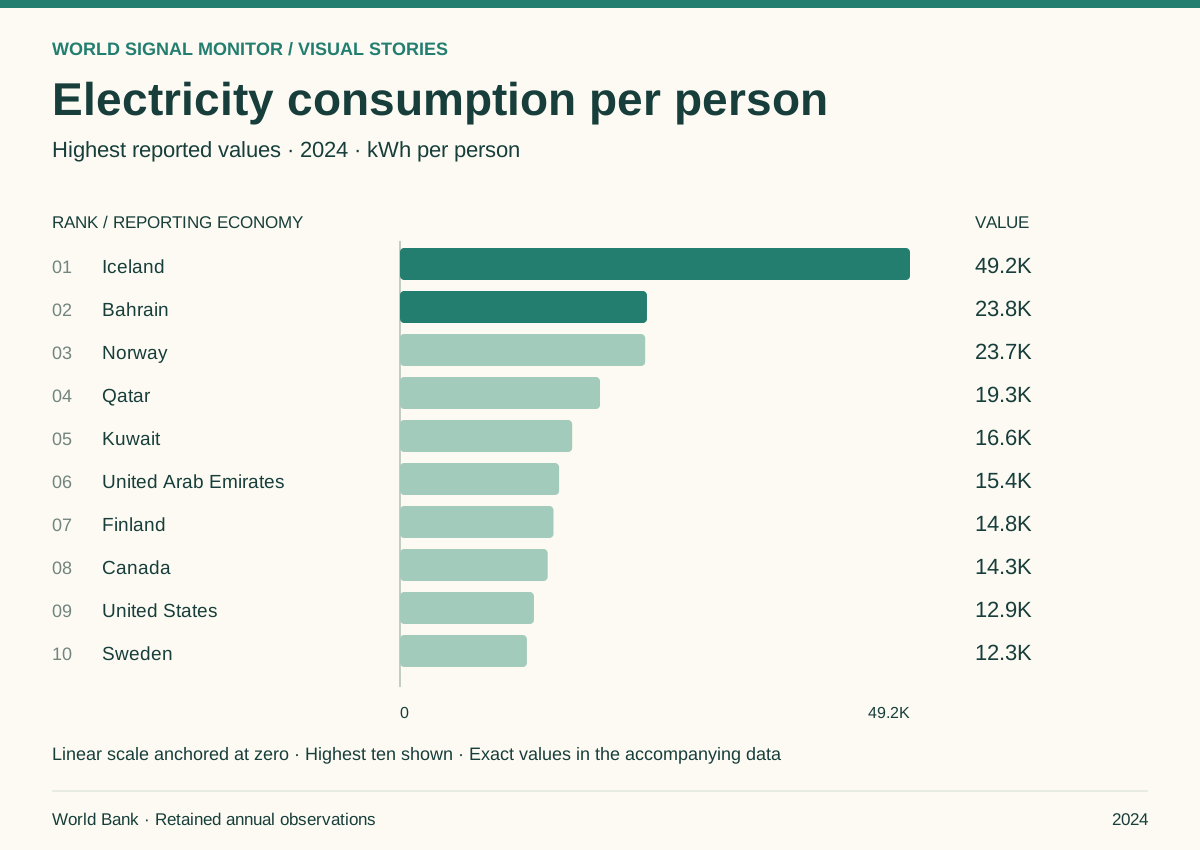
Electricity consumption per person
Iceland has the highest retained value for 2024. 149 of 217 reporting economies have a value in this comparison.
Explore the story →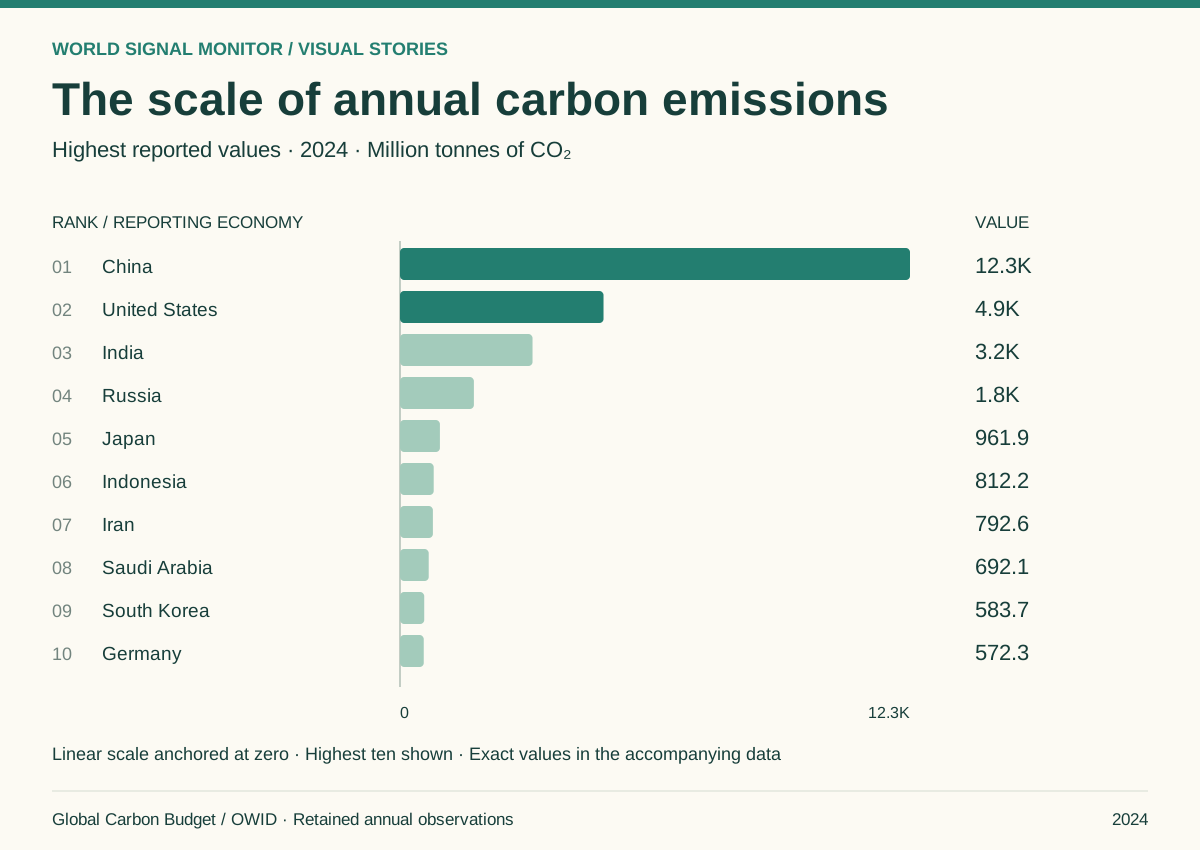
The scale of annual carbon emissions
China has the highest retained value for 2024. 204 of 206 reporting economies have a value in this comparison.
Explore the story →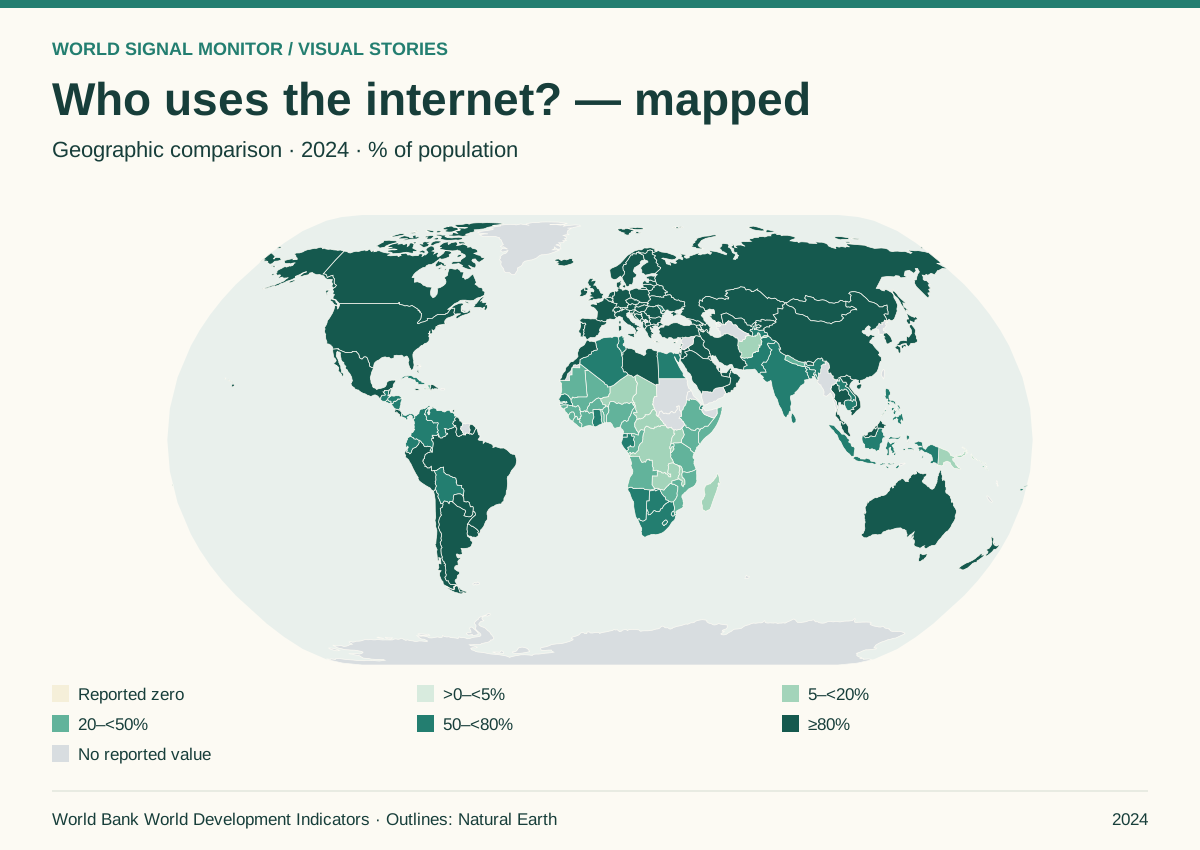
Who uses the internet? — mapped
Compare reported percentages across 182 economies in 2024. Grey areas have no retained value.
Explore the story →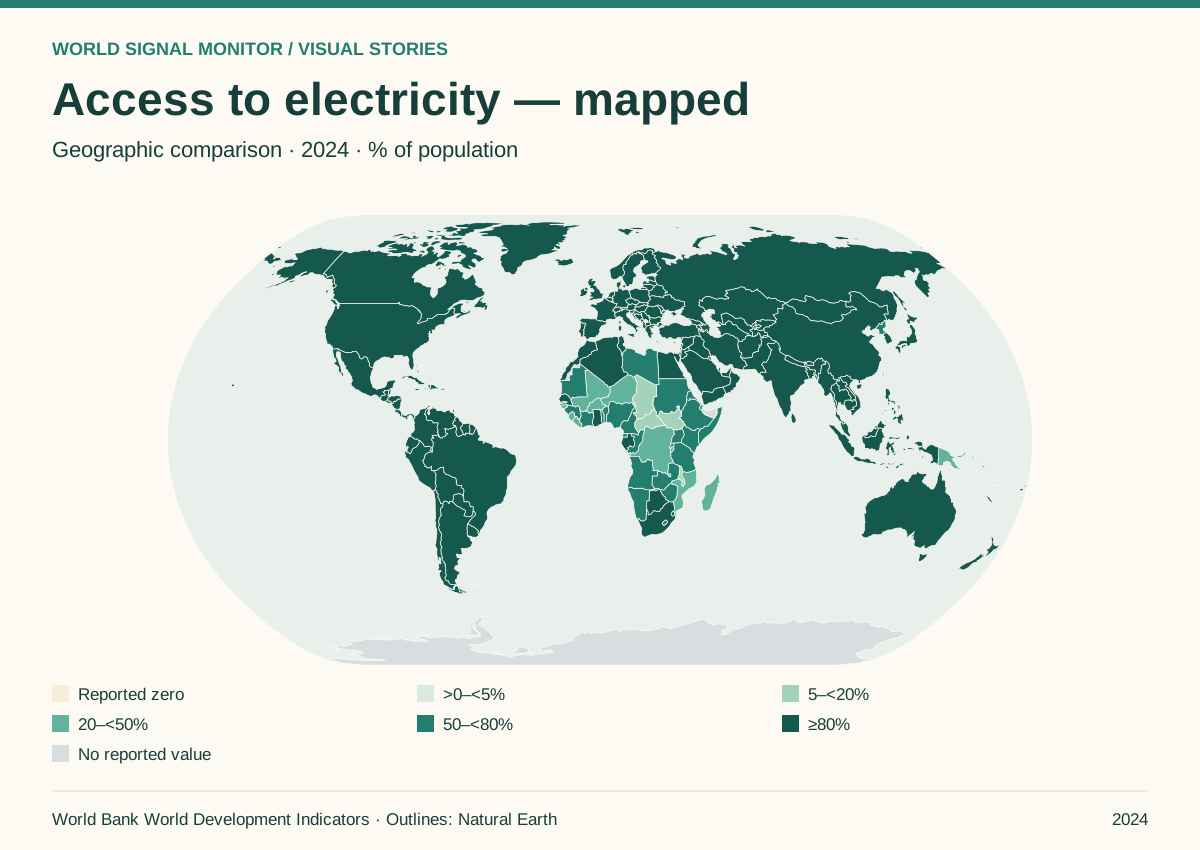
Access to electricity — mapped
Compare reported percentages across 215 economies in 2024. Grey areas have no retained value.
Explore the story →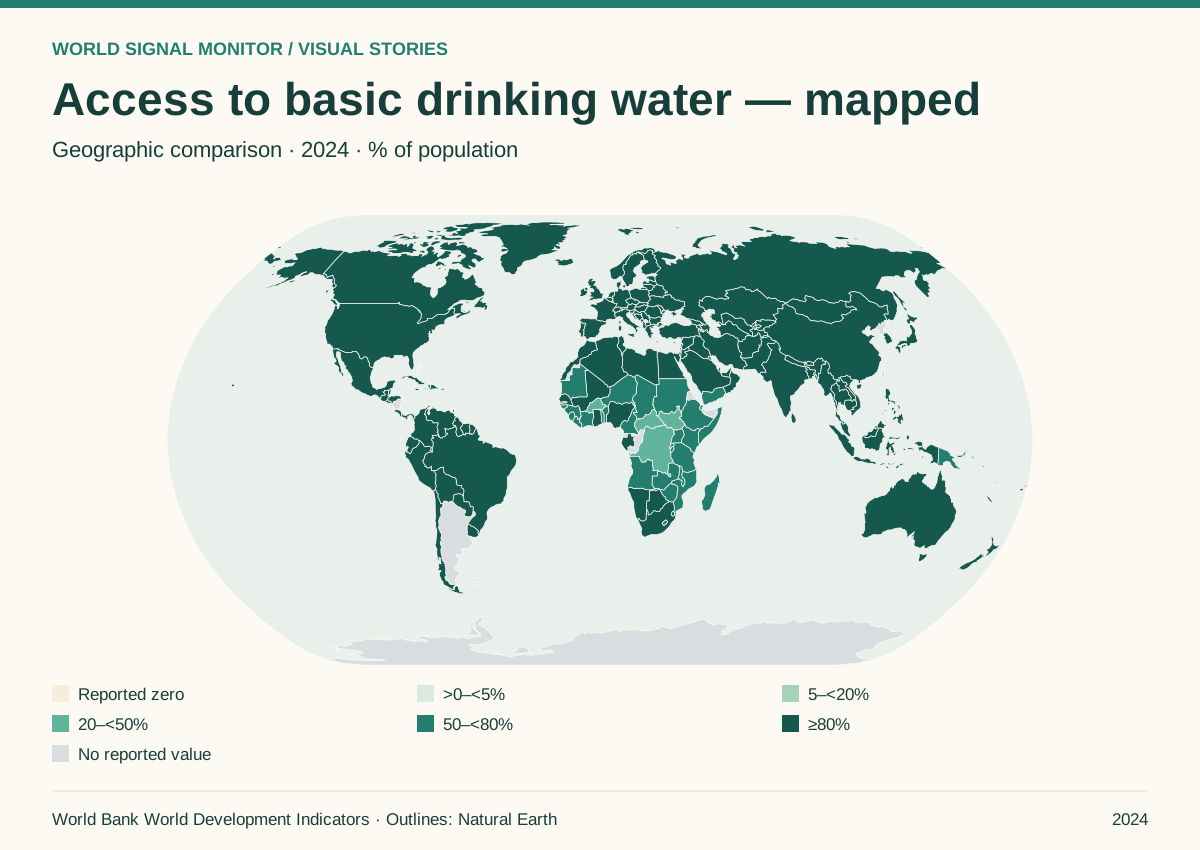
Access to basic drinking water — mapped
Compare reported percentages across 202 economies in 2024. Grey areas have no retained value.
Explore the story →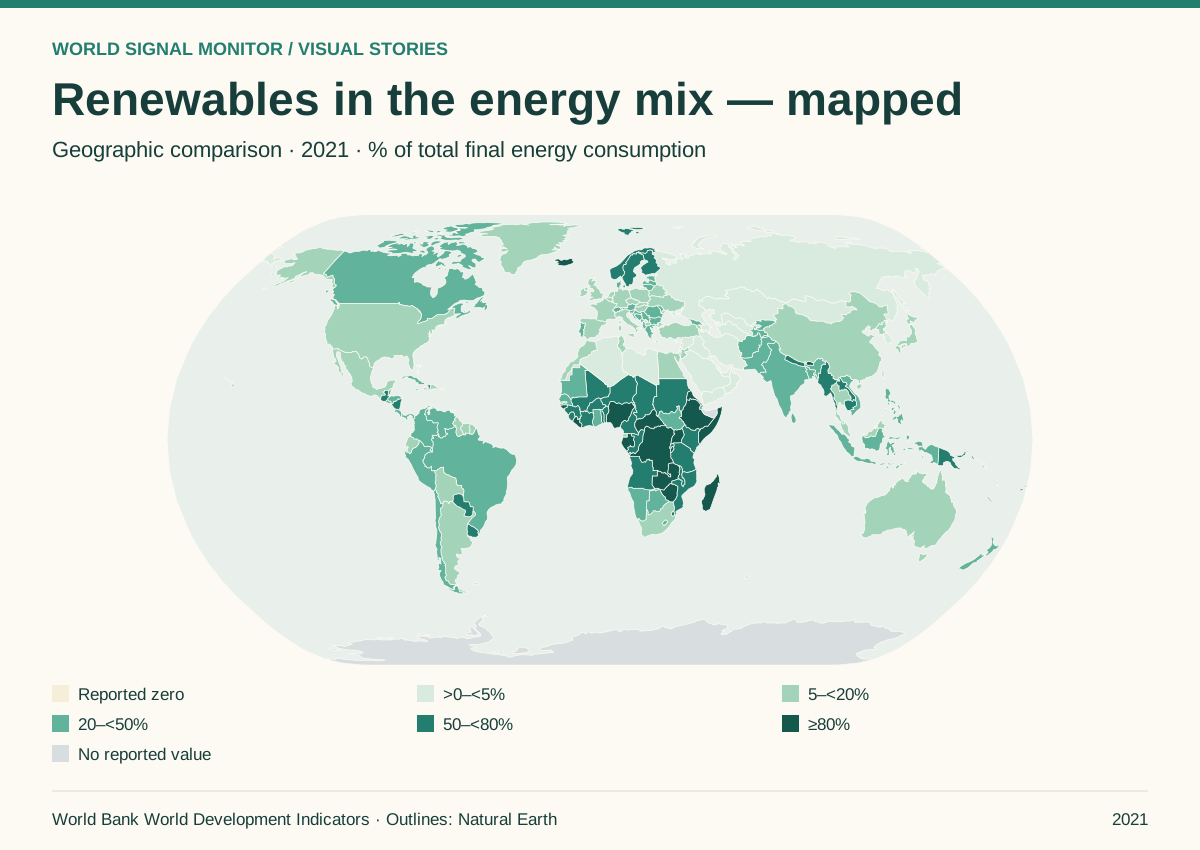
Renewables in the energy mix — mapped
Compare reported percentages across 212 economies in 2021. Grey areas have no retained value.
Explore the story →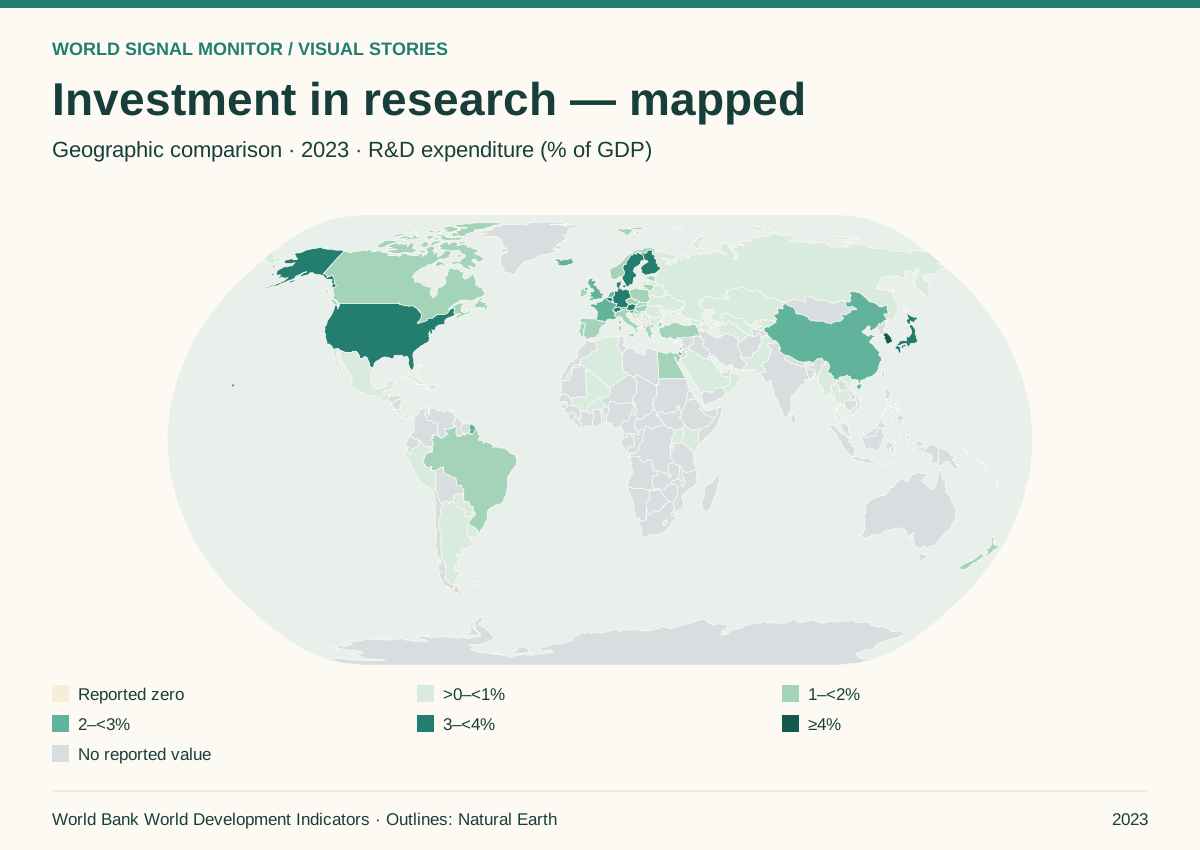
Investment in research — mapped
Compare reported percentages across 84 economies in 2023. Grey areas have no retained value.
Explore the story →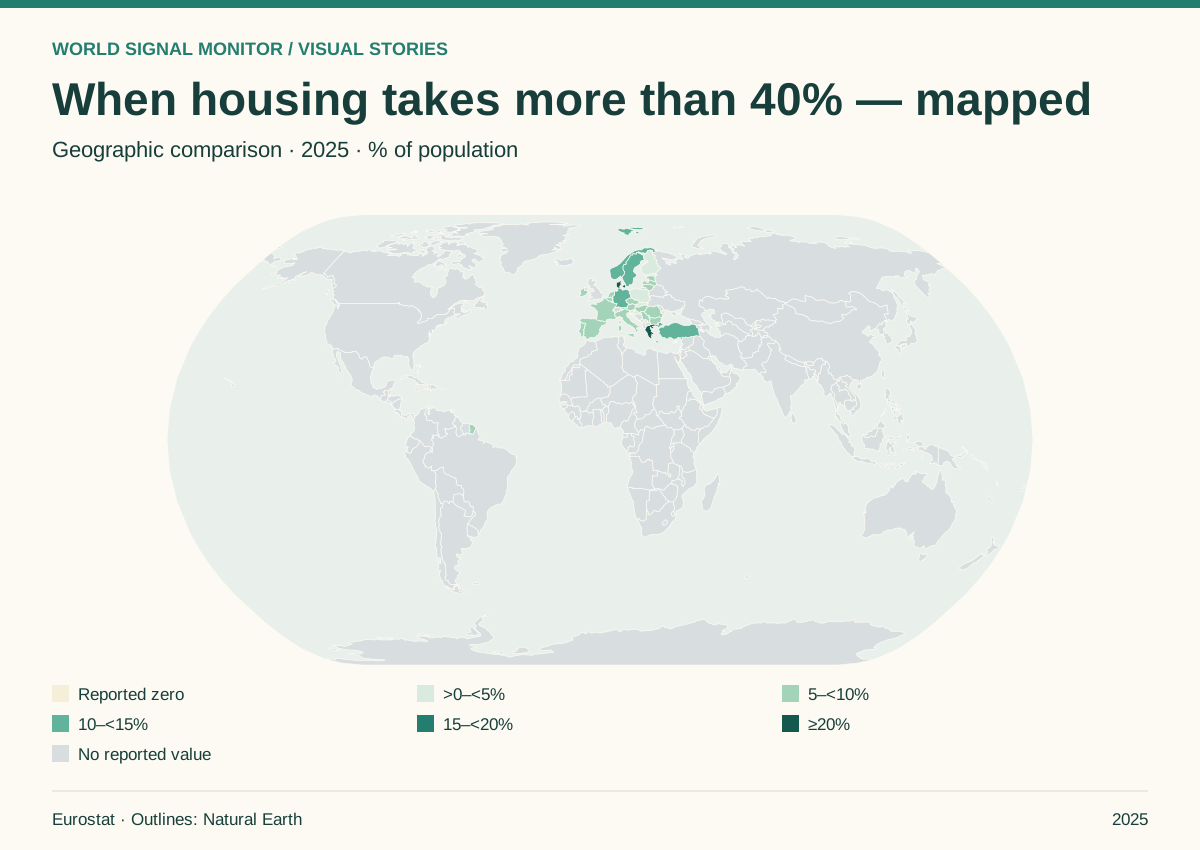
When housing takes more than 40% — mapped
Compare reported percentages across 30 economies in 2025. Grey areas have no retained value.
Explore the story →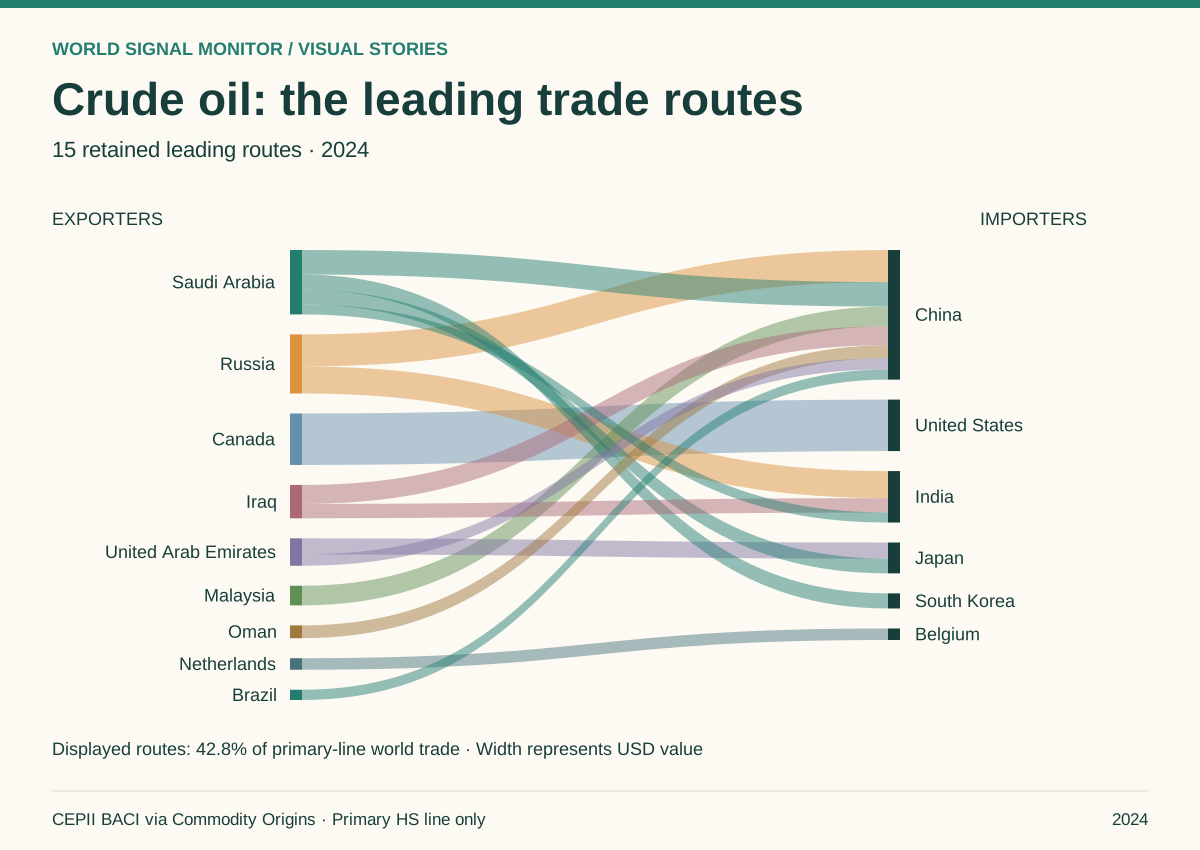
Crude oil: the leading trade routes
Canada → United States is the largest retained route. Displayed routes cover 42.8% of primary-line world trade.
Explore the story →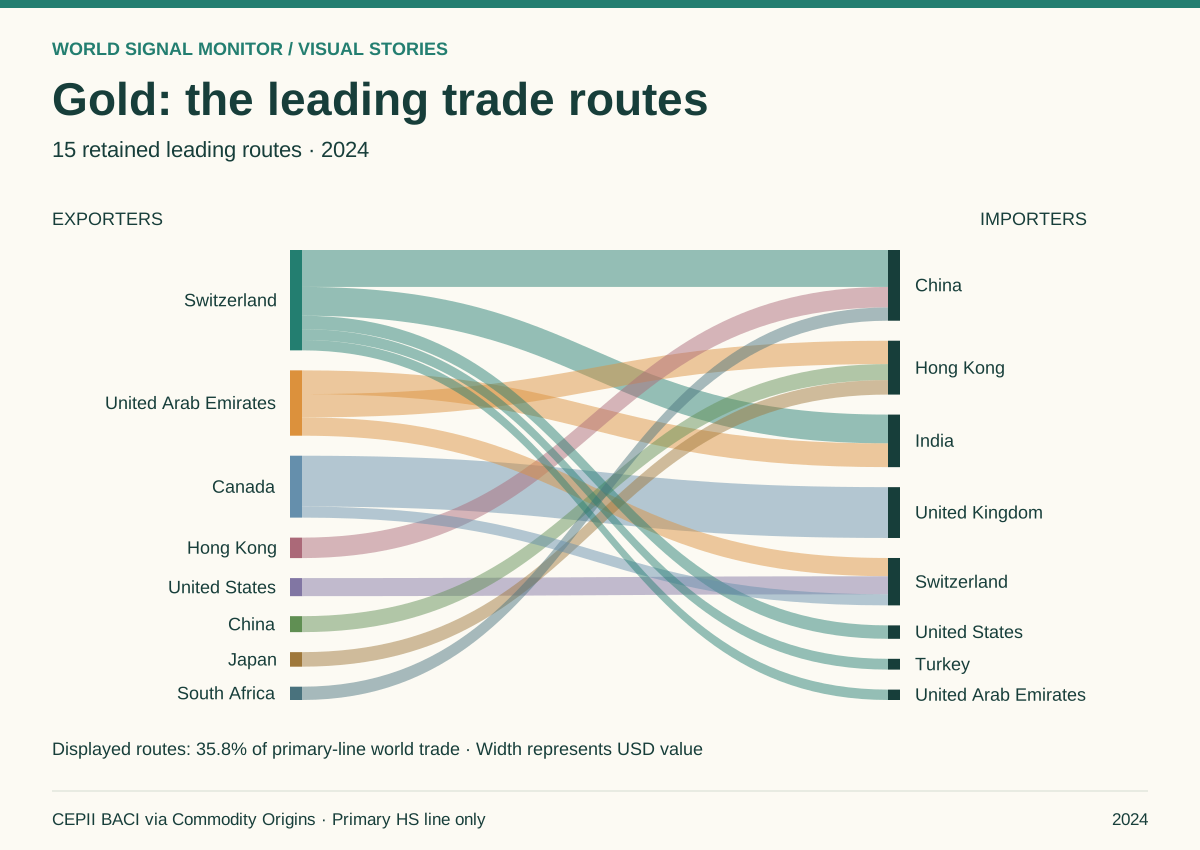
Gold: the leading trade routes
Canada → United Kingdom is the largest retained route. Displayed routes cover 35.8% of primary-line world trade.
Explore the story →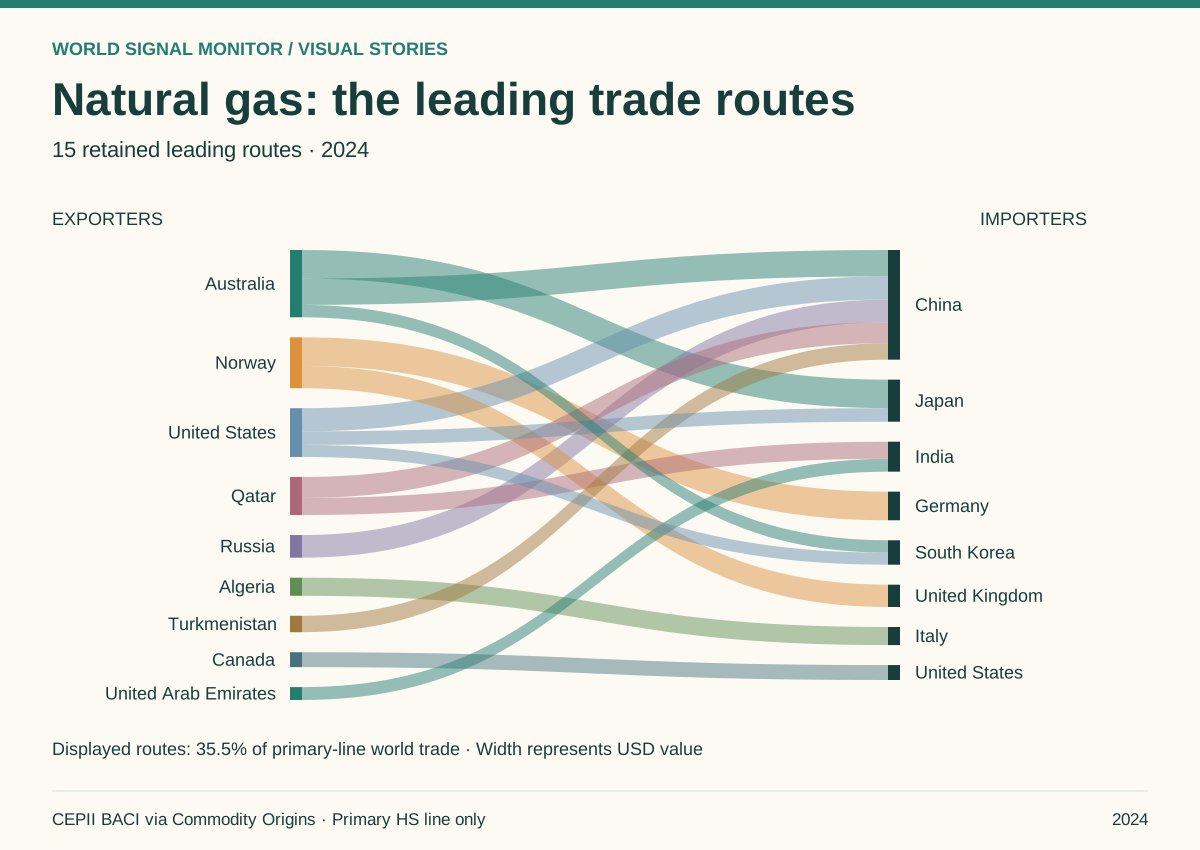
Natural gas: the leading trade routes
Norway → Germany is the largest retained route. Displayed routes cover 35.5% of primary-line world trade.
Explore the story →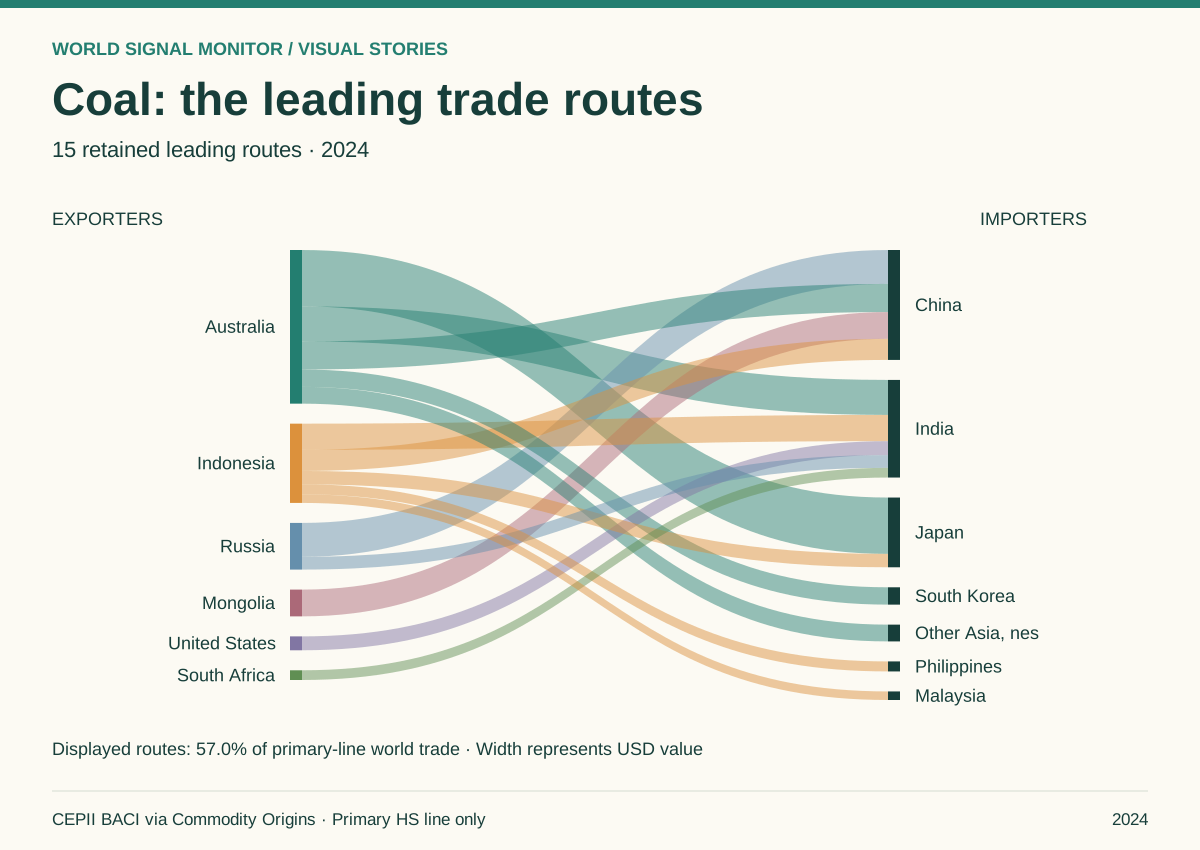
Coal: the leading trade routes
Australia → Japan is the largest retained route. Displayed routes cover 57.0% of primary-line world trade.
Explore the story →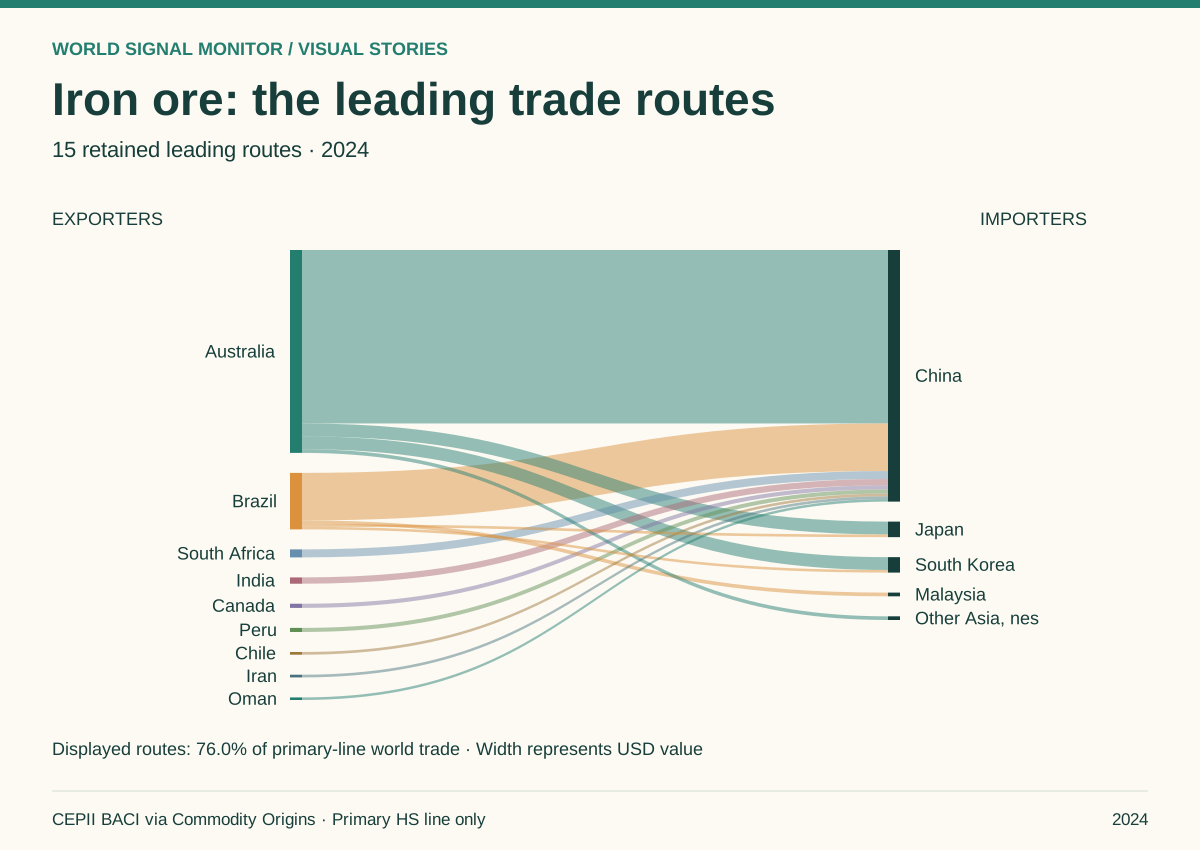
Iron ore: the leading trade routes
Australia → China is the largest retained route. Displayed routes cover 76.0% of primary-line world trade.
Explore the story →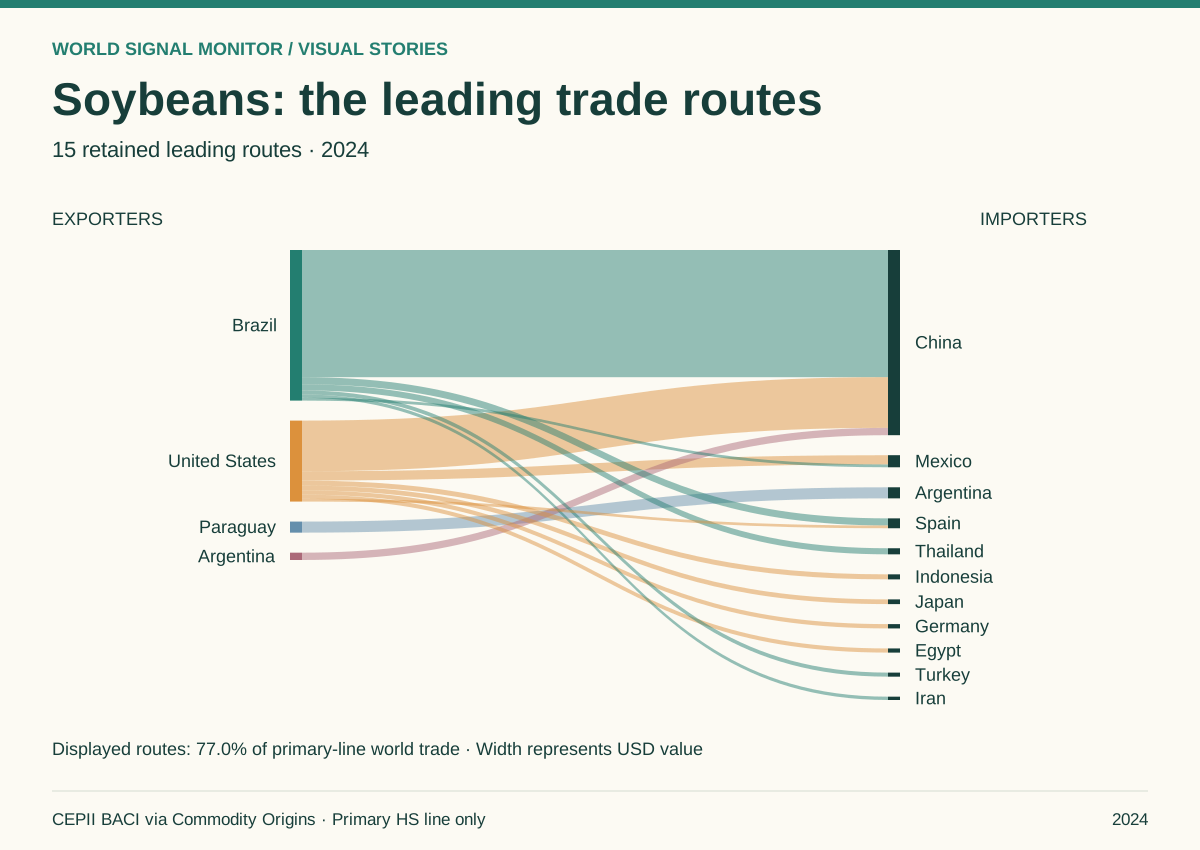
Soybeans: the leading trade routes
Brazil → China is the largest retained route. Displayed routes cover 77.0% of primary-line world trade.
Explore the story →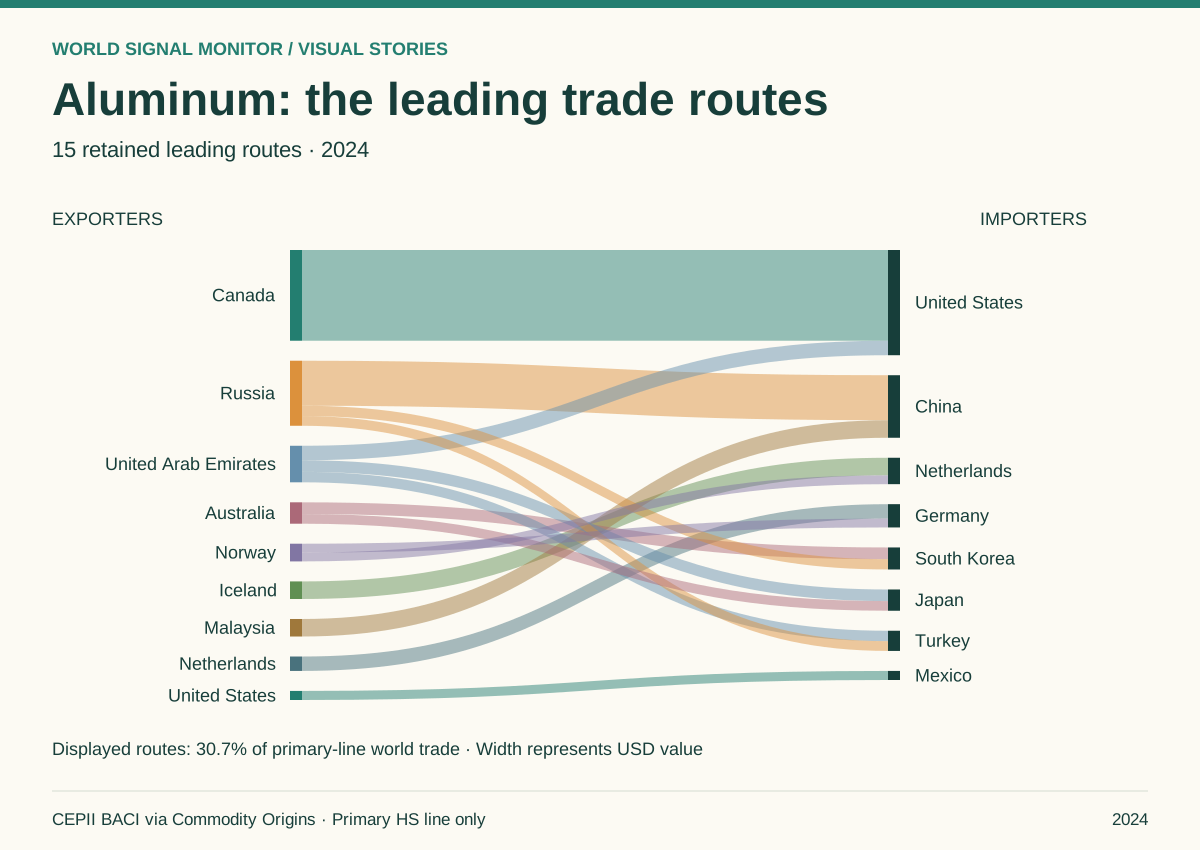
Aluminum: the leading trade routes
Canada → United States is the largest retained route. Displayed routes cover 30.7% of primary-line world trade.
Explore the story →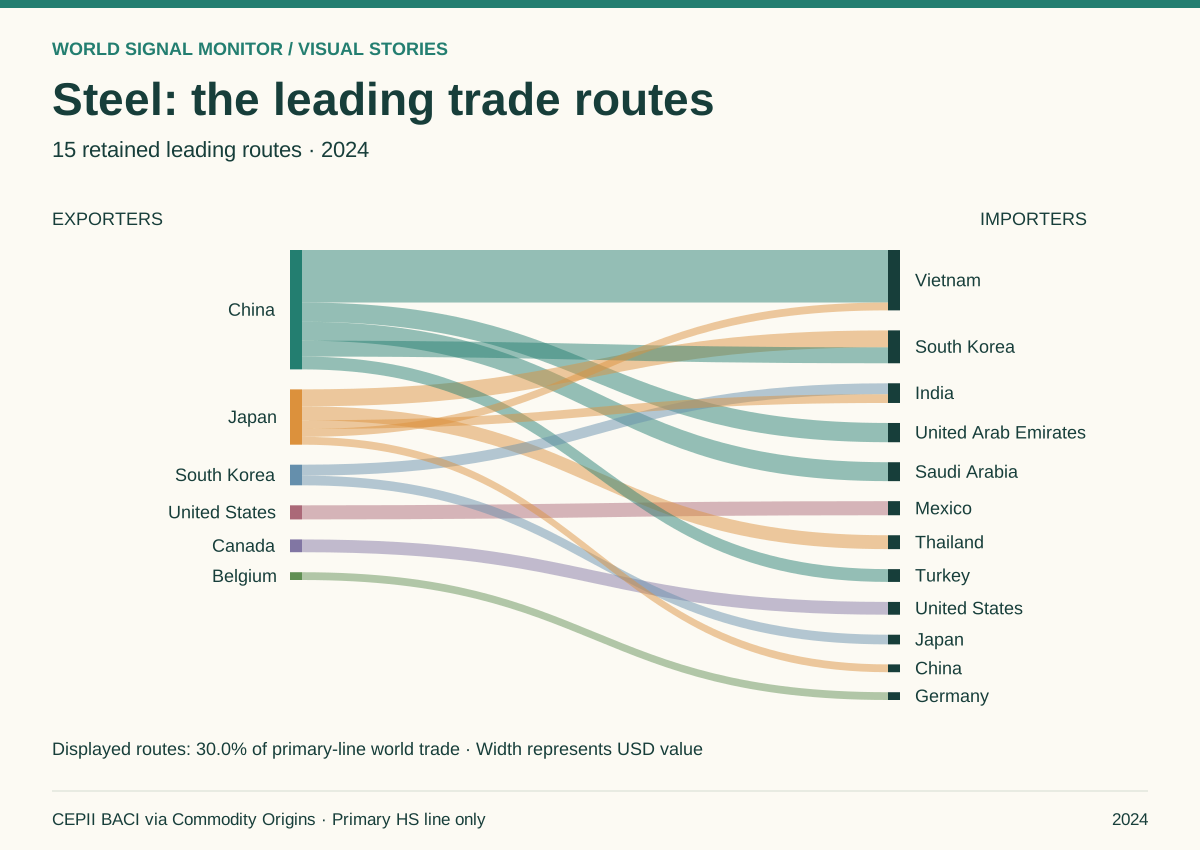
Steel: the leading trade routes
China → Vietnam is the largest retained route. Displayed routes cover 30.0% of primary-line world trade.
Explore the story →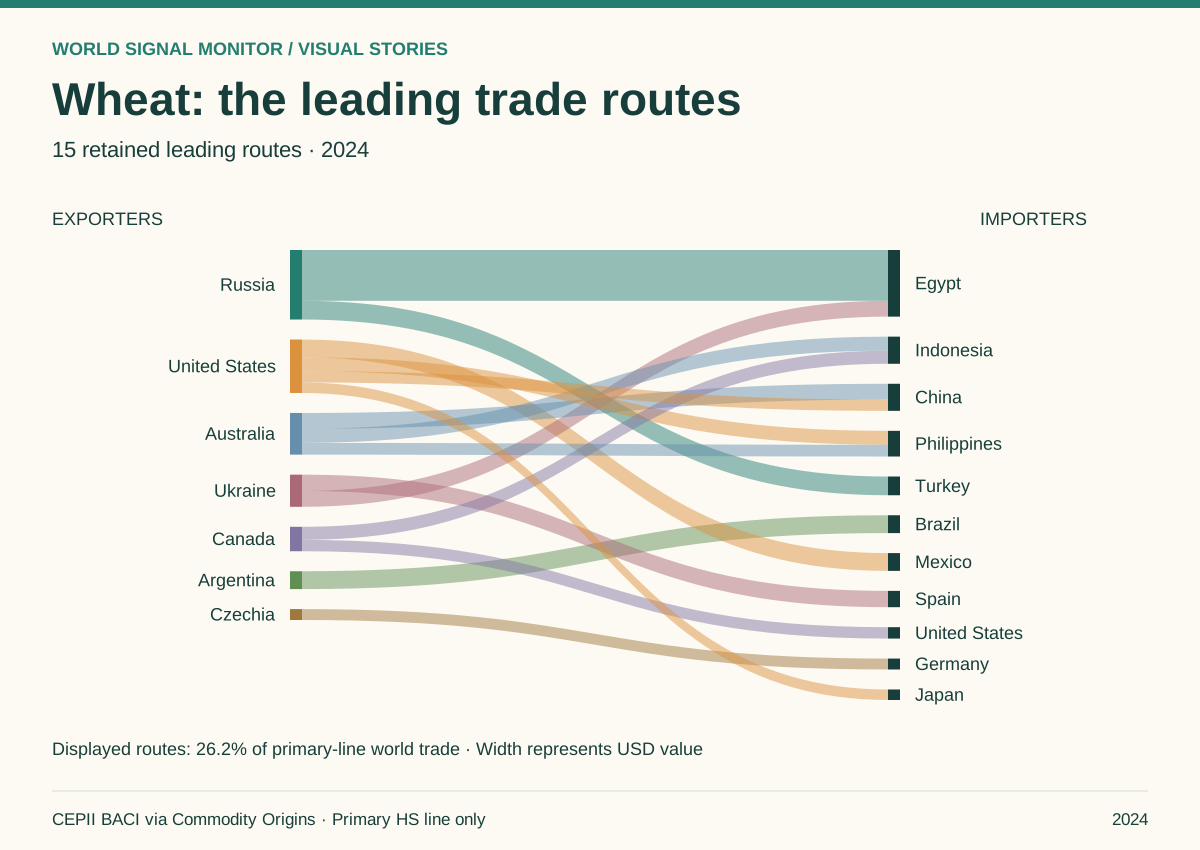
Wheat: the leading trade routes
Russia → Egypt is the largest retained route. Displayed routes cover 26.2% of primary-line world trade.
Explore the story →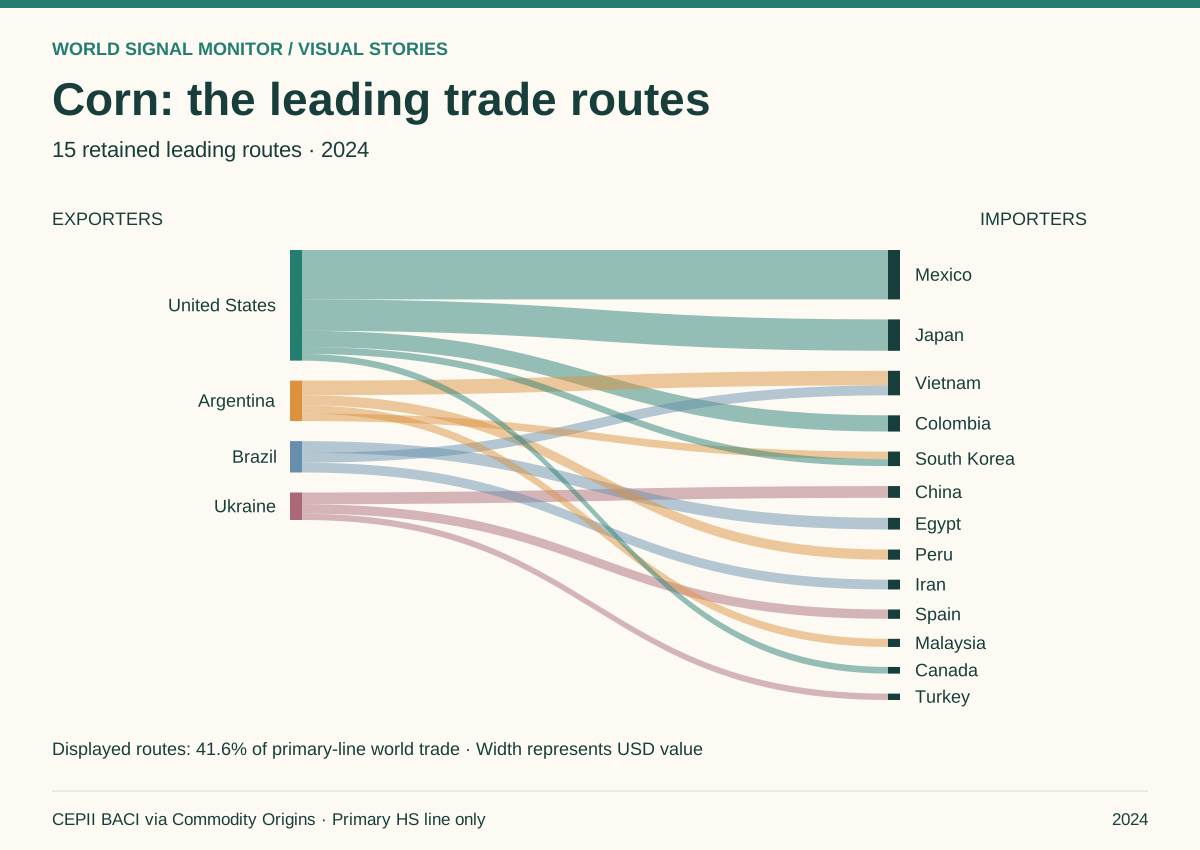
Corn: the leading trade routes
United States → Mexico is the largest retained route. Displayed routes cover 41.6% of primary-line world trade.
Explore the story →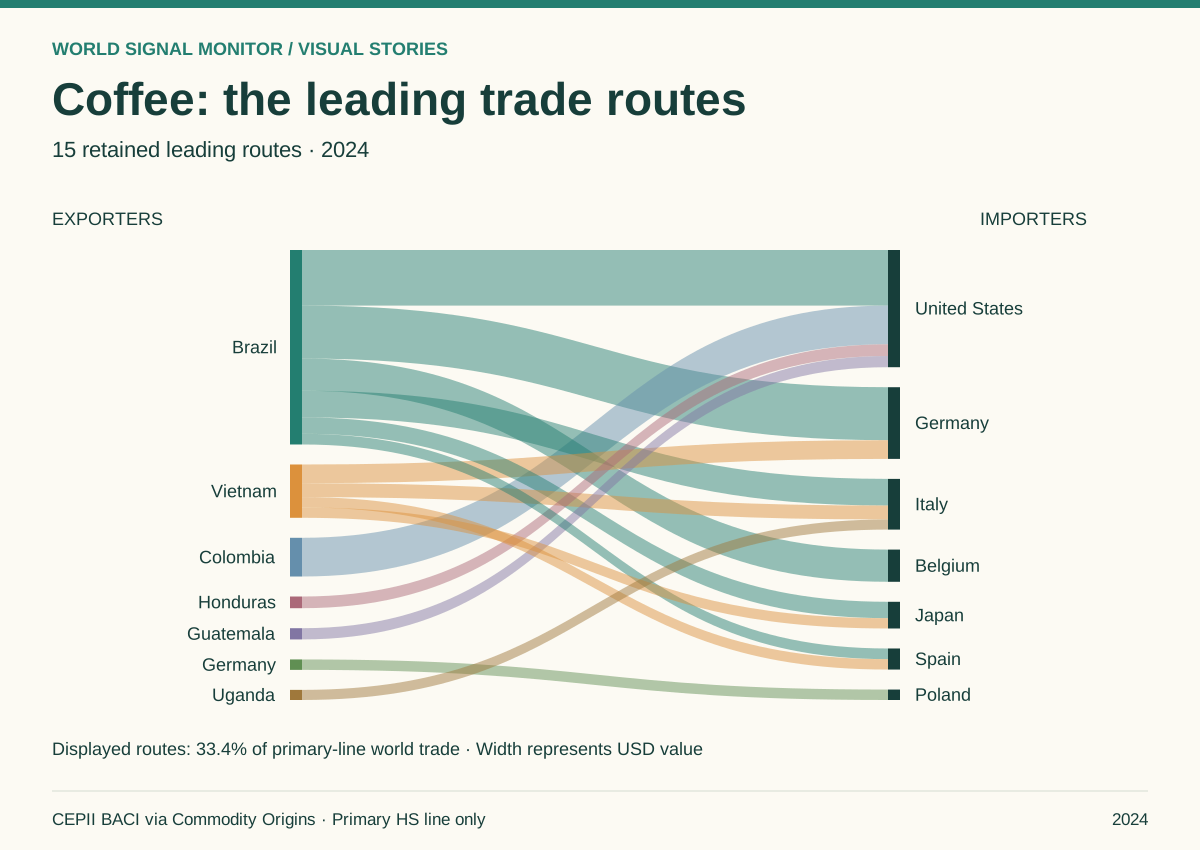
Coffee: the leading trade routes
Brazil → United States is the largest retained route. Displayed routes cover 33.4% of primary-line world trade.
Explore the story →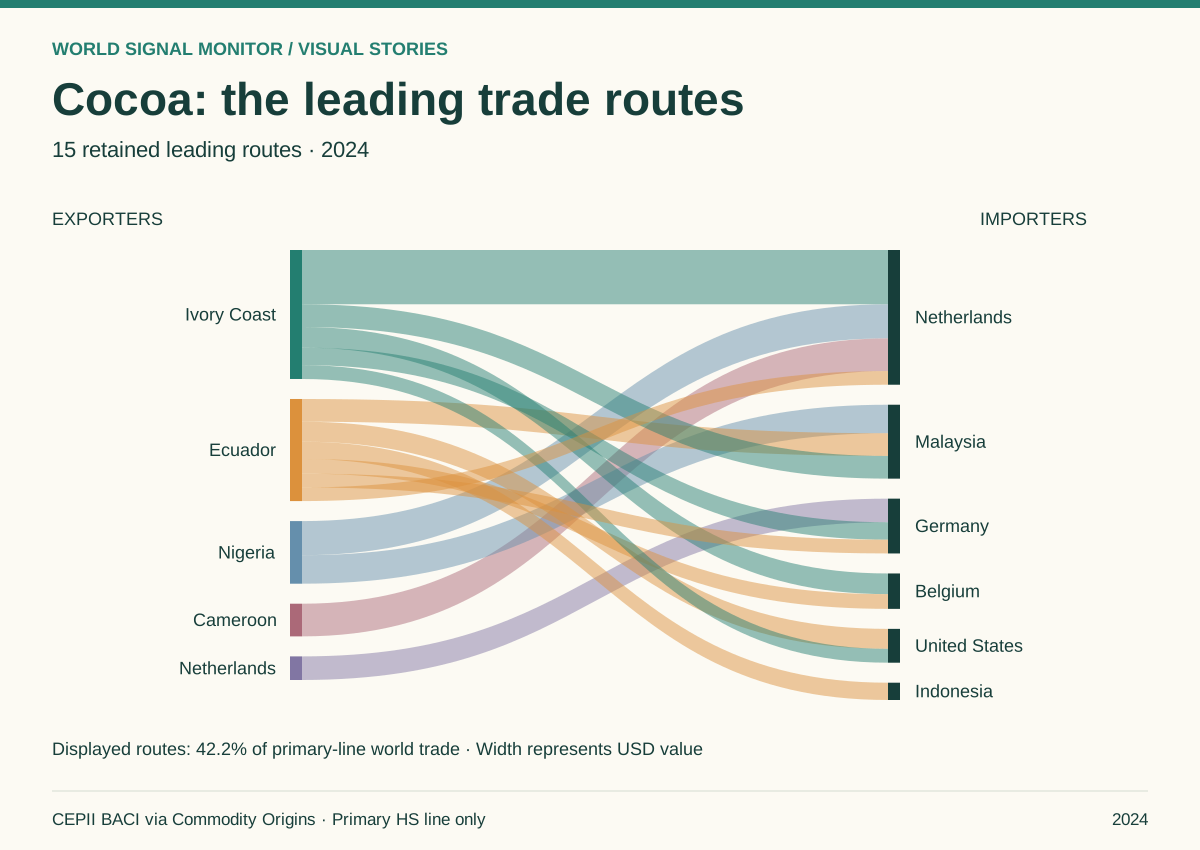
Cocoa: the leading trade routes
Ivory Coast (Côte d'Ivoire) → Netherlands is the largest retained route. Displayed routes cover 42.2% of primary-line world trade.
Explore the story →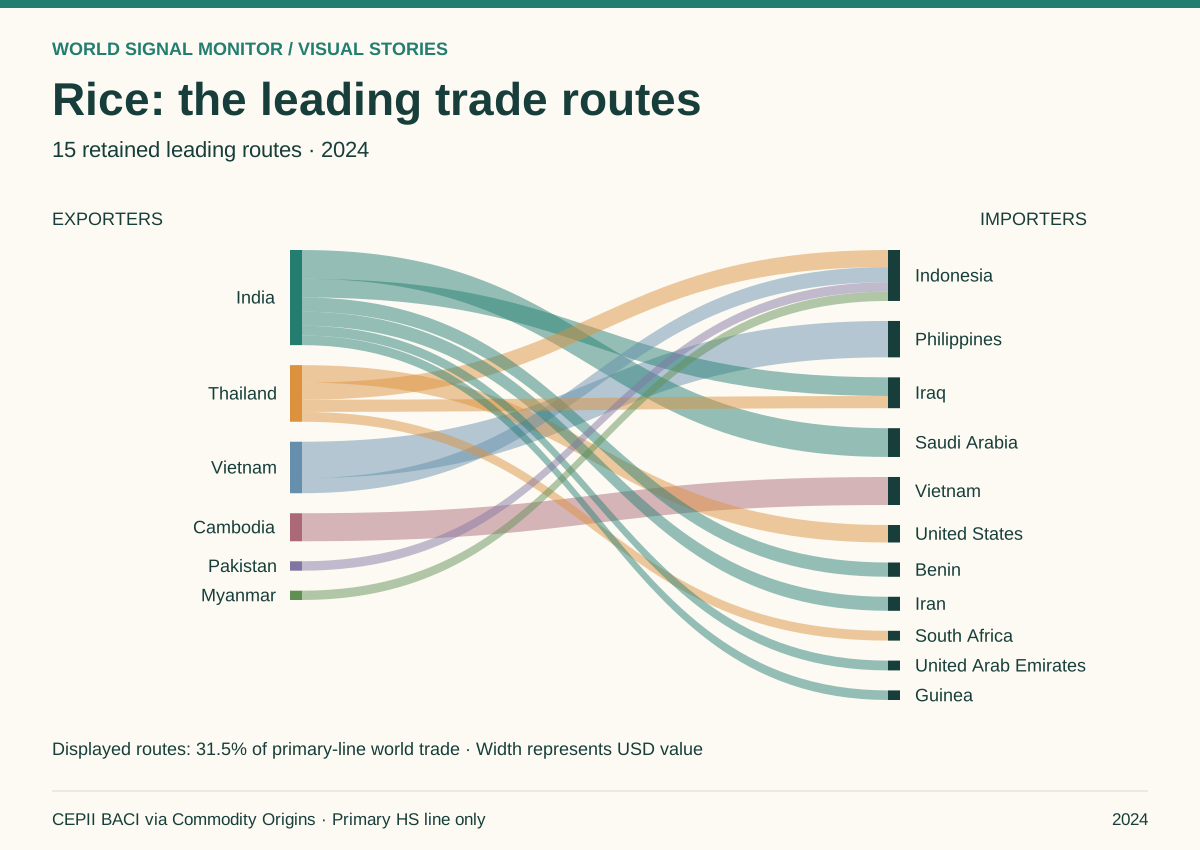
Rice: the leading trade routes
Vietnam → Philippines is the largest retained route. Displayed routes cover 31.5% of primary-line world trade.
Explore the story →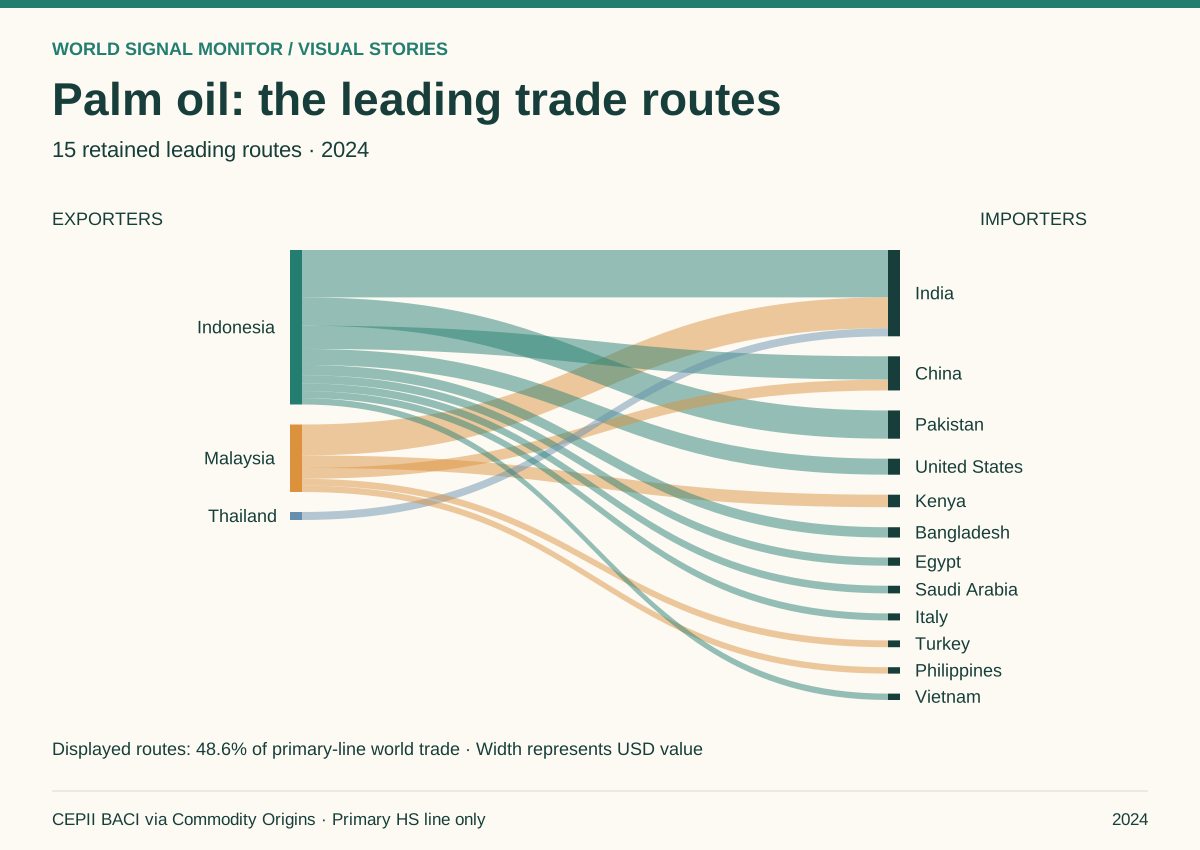
Palm oil: the leading trade routes
Indonesia → India is the largest retained route. Displayed routes cover 48.6% of primary-line world trade.
Explore the story →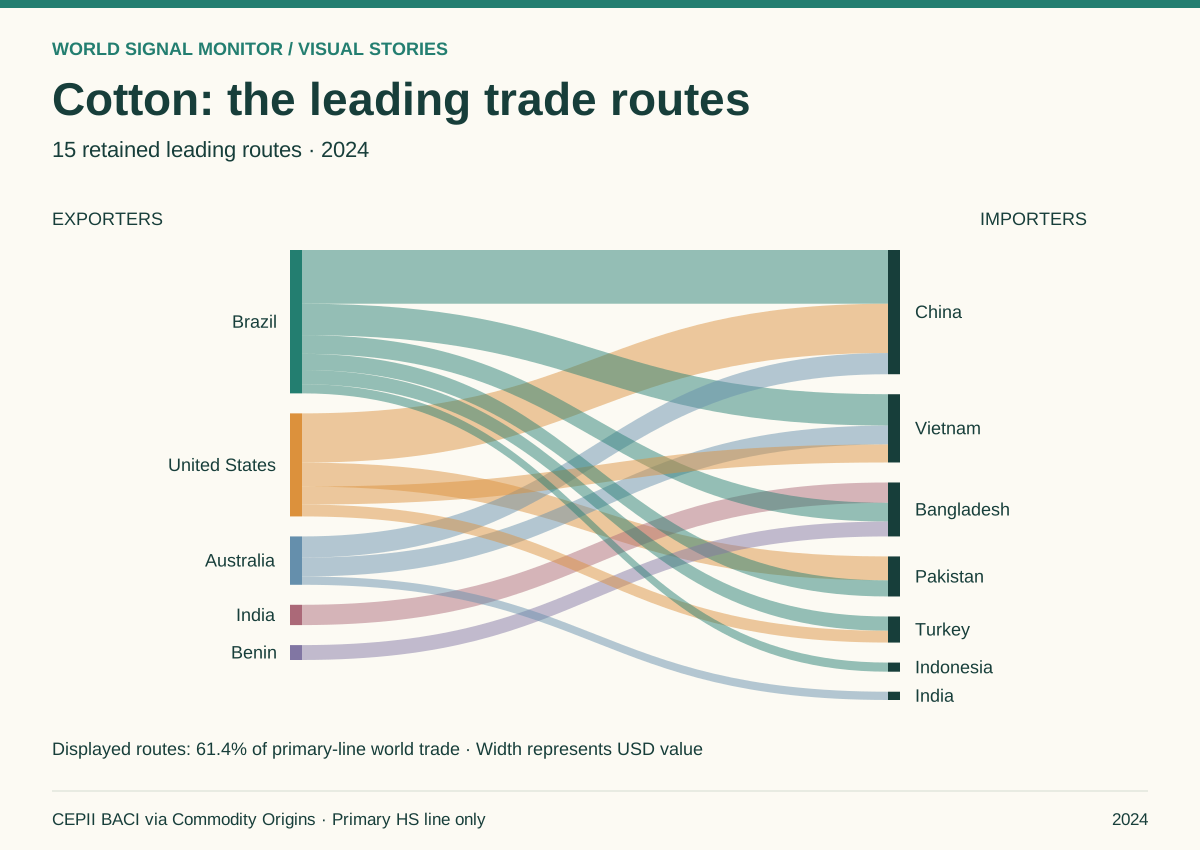
Cotton: the leading trade routes
Brazil → China is the largest retained route. Displayed routes cover 61.4% of primary-line world trade.
Explore the story →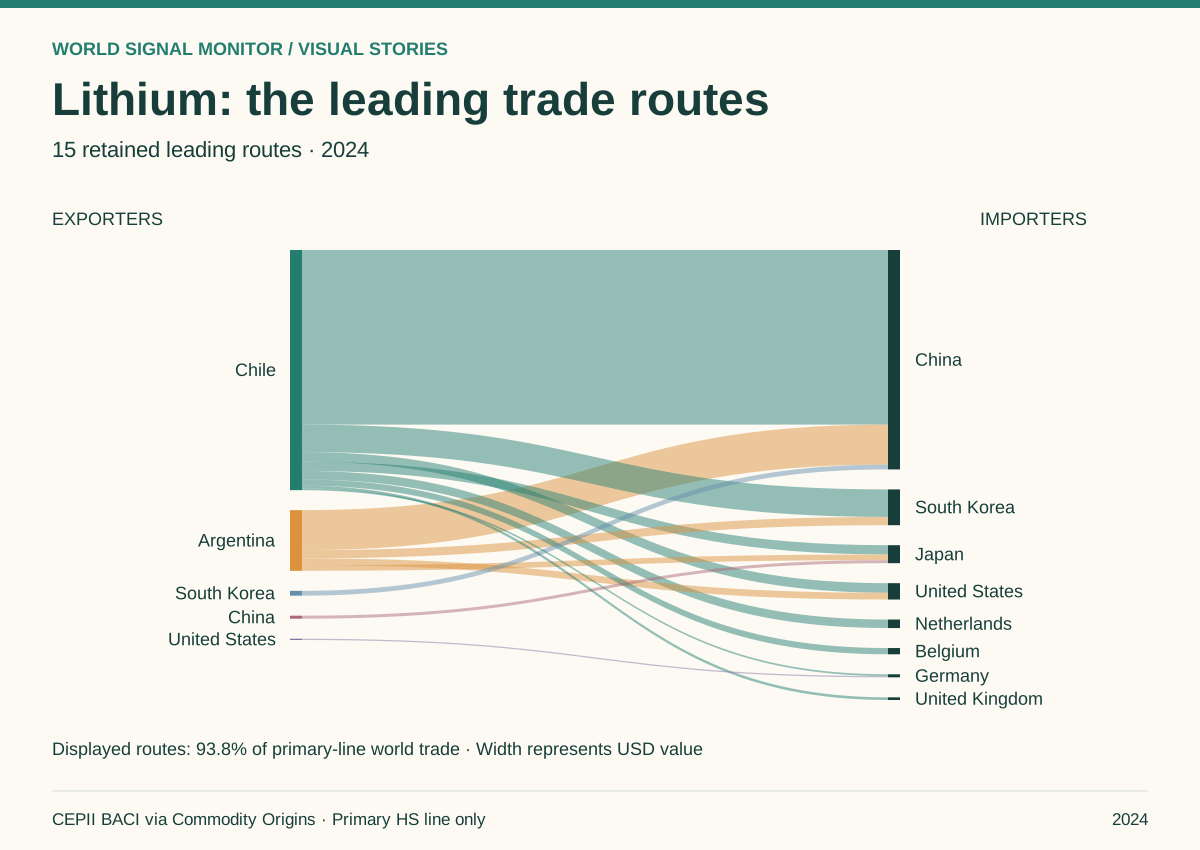
Lithium: the leading trade routes
Chile → China is the largest retained route. Displayed routes cover 93.8% of primary-line world trade.
Explore the story →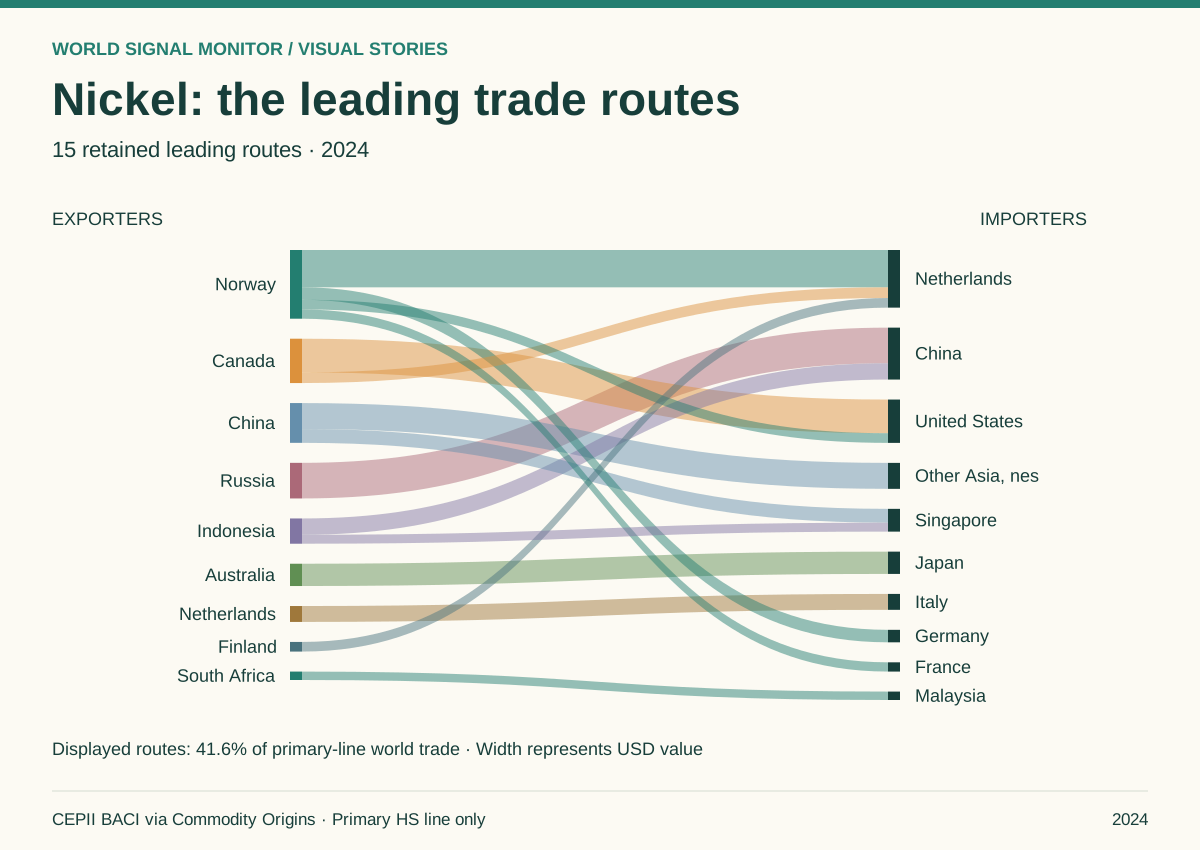
Nickel: the leading trade routes
Norway → Netherlands is the largest retained route. Displayed routes cover 41.6% of primary-line world trade.
Explore the story →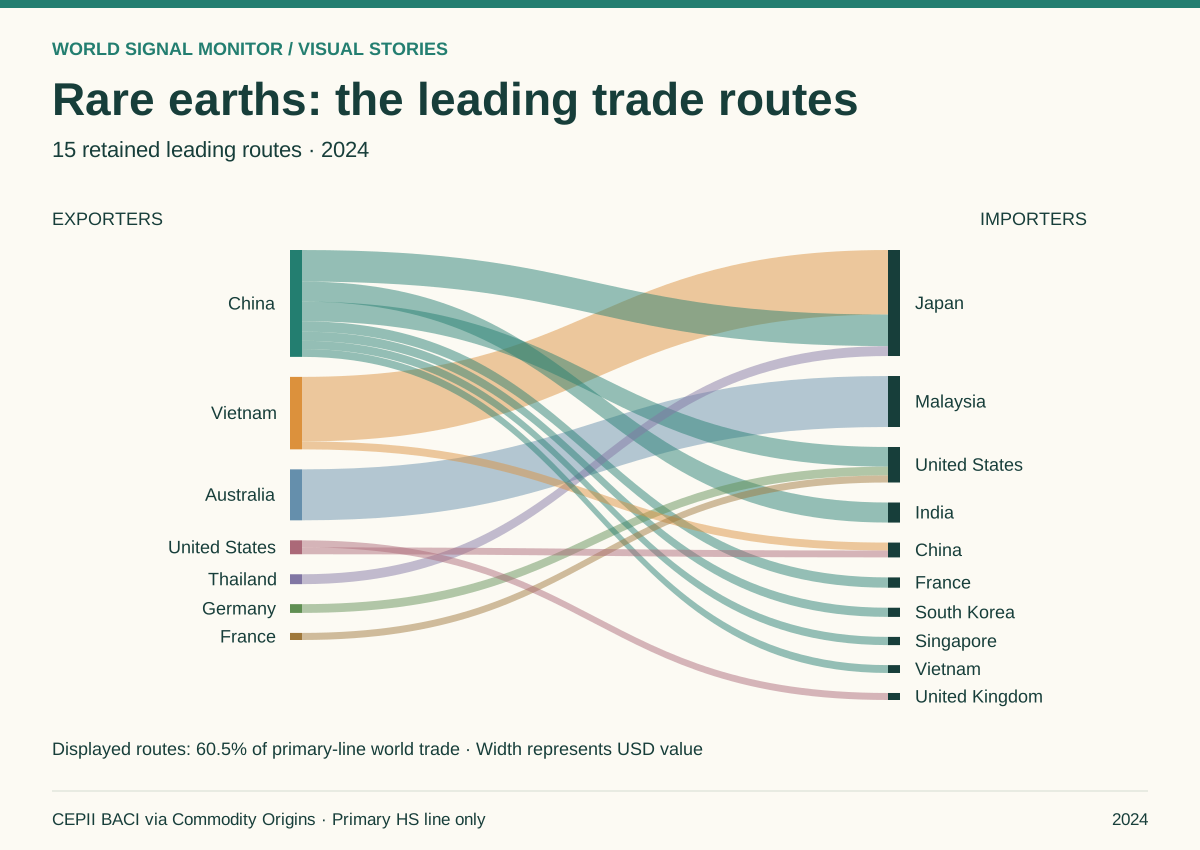
Rare earths: the leading trade routes
Vietnam → Japan is the largest retained route. Displayed routes cover 60.5% of primary-line world trade.
Explore the story →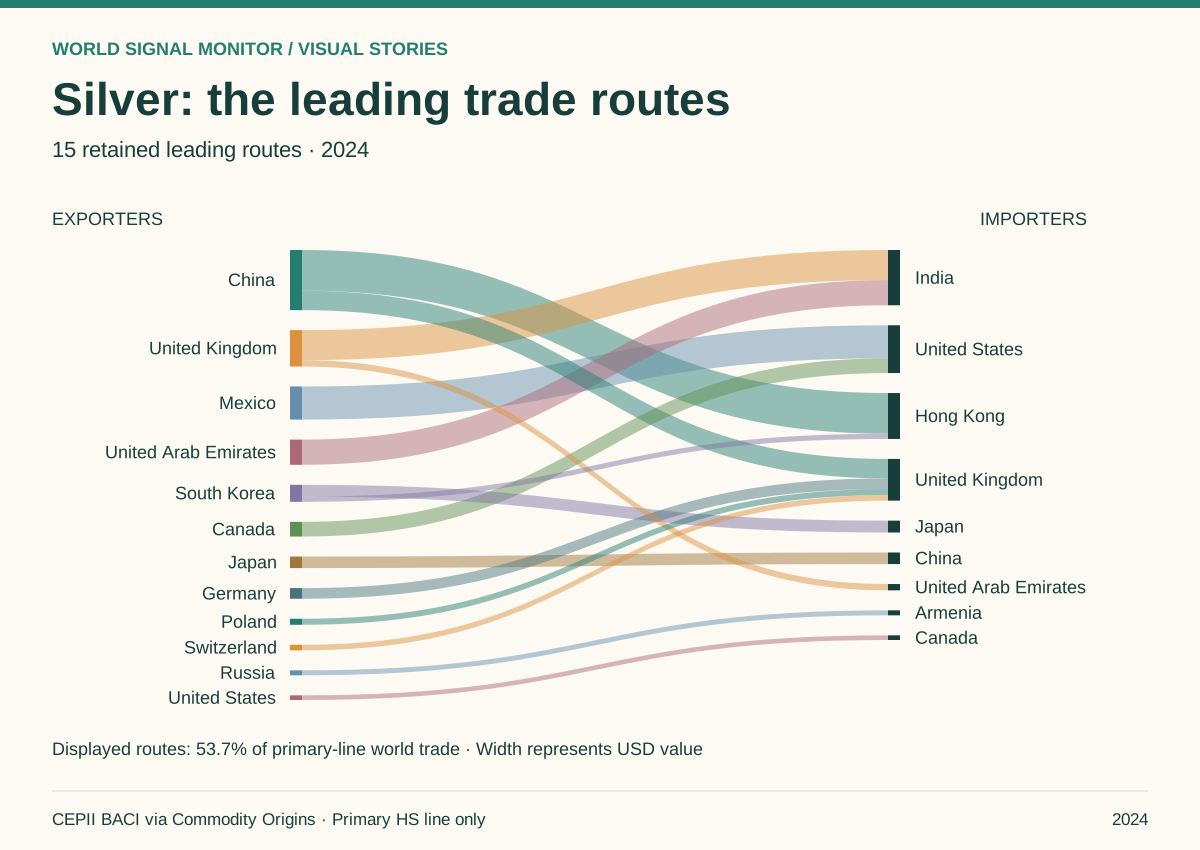
Silver: the leading trade routes
China → Hong Kong is the largest retained route. Displayed routes cover 53.7% of primary-line world trade.
Explore the story →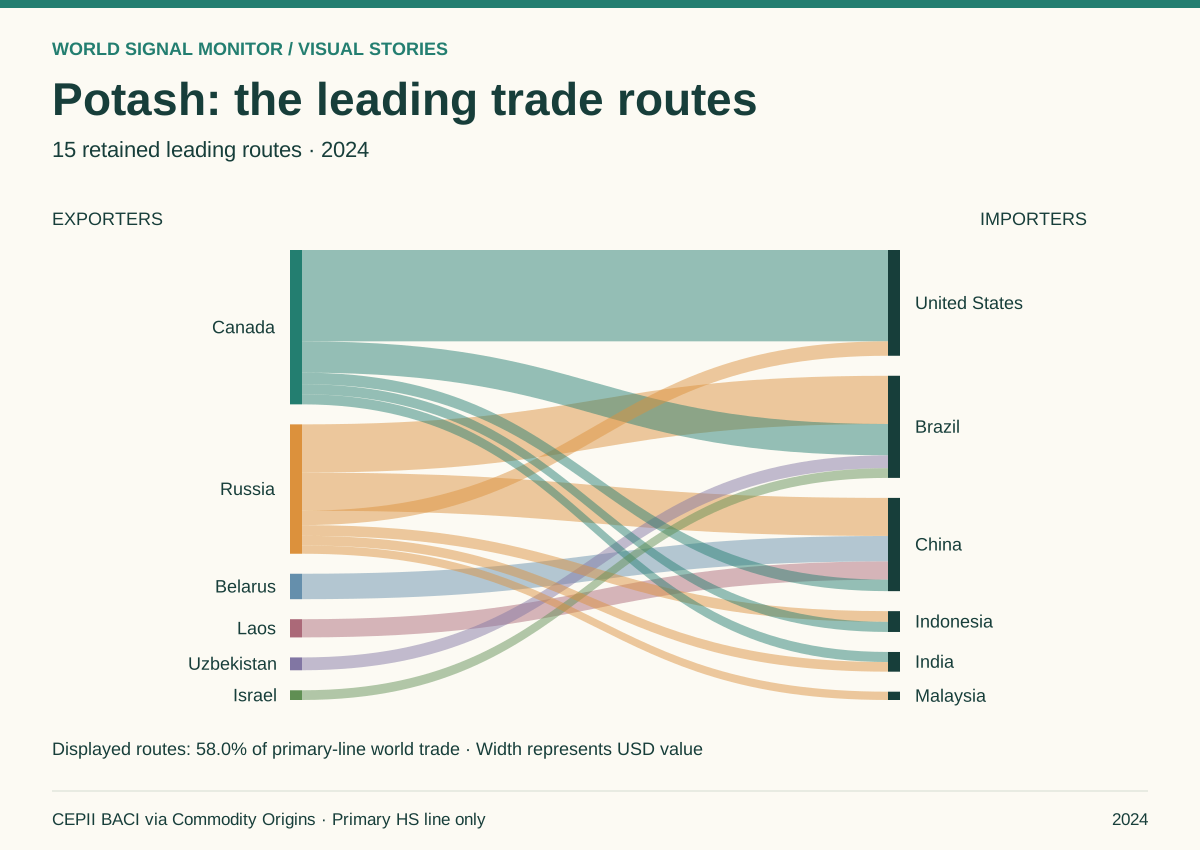
Potash: the leading trade routes
Canada → United States is the largest retained route. Displayed routes cover 58.0% of primary-line world trade.
Explore the story →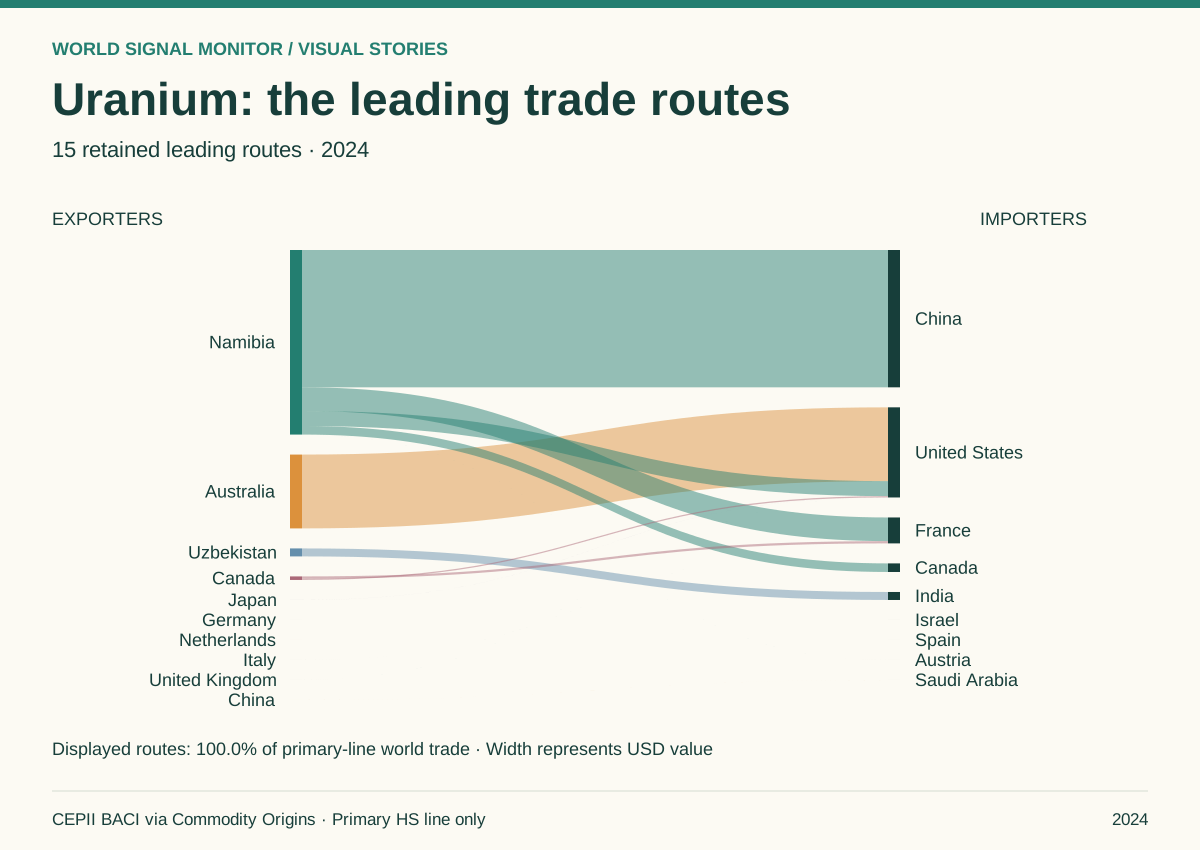
Uranium: the leading trade routes
Namibia → China is the largest retained route. Displayed routes cover 100.0% of primary-line world trade.
Explore the story →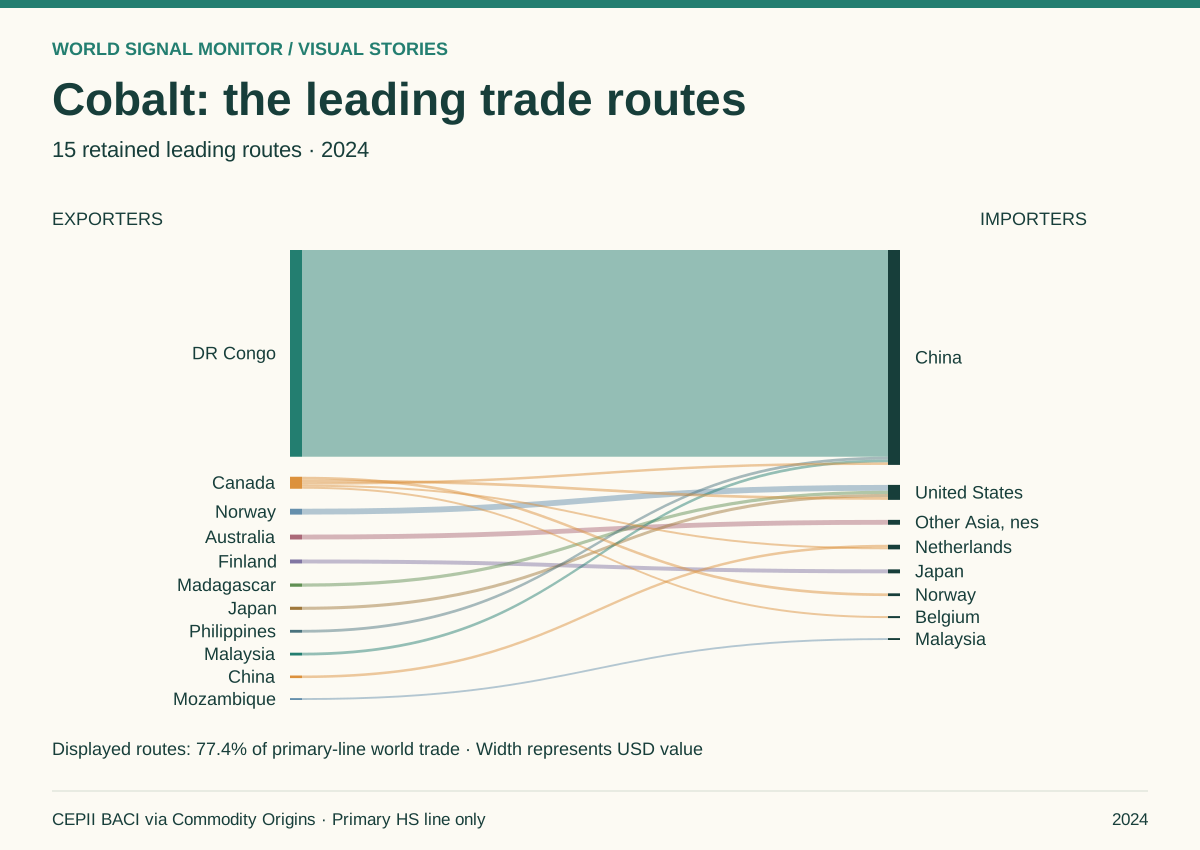
Cobalt: the leading trade routes
DR Congo (Democratic Republic of the Congo) → China is the largest retained route. Displayed routes cover 77.4% of primary-line world trade.
Explore the story →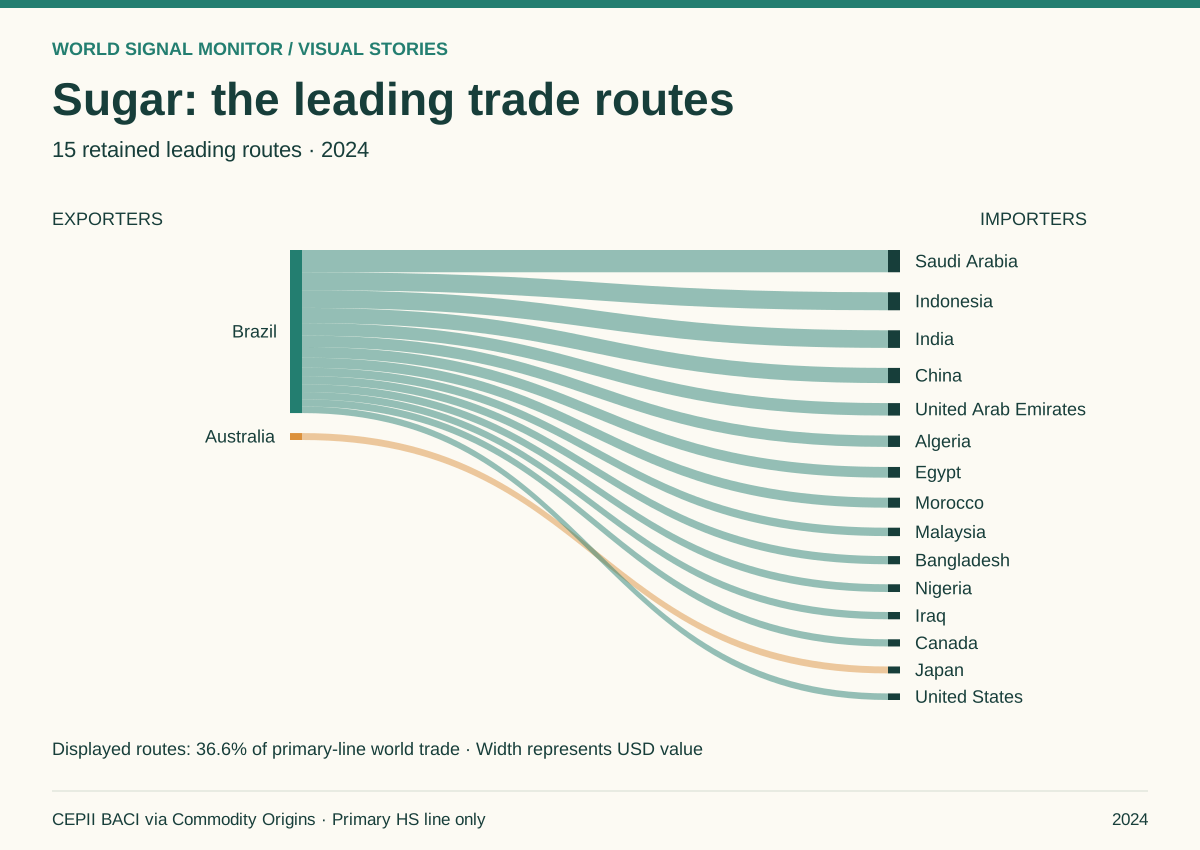
Sugar: the leading trade routes
Brazil → Saudi Arabia is the largest retained route. Displayed routes cover 36.6% of primary-line world trade.
Explore the story →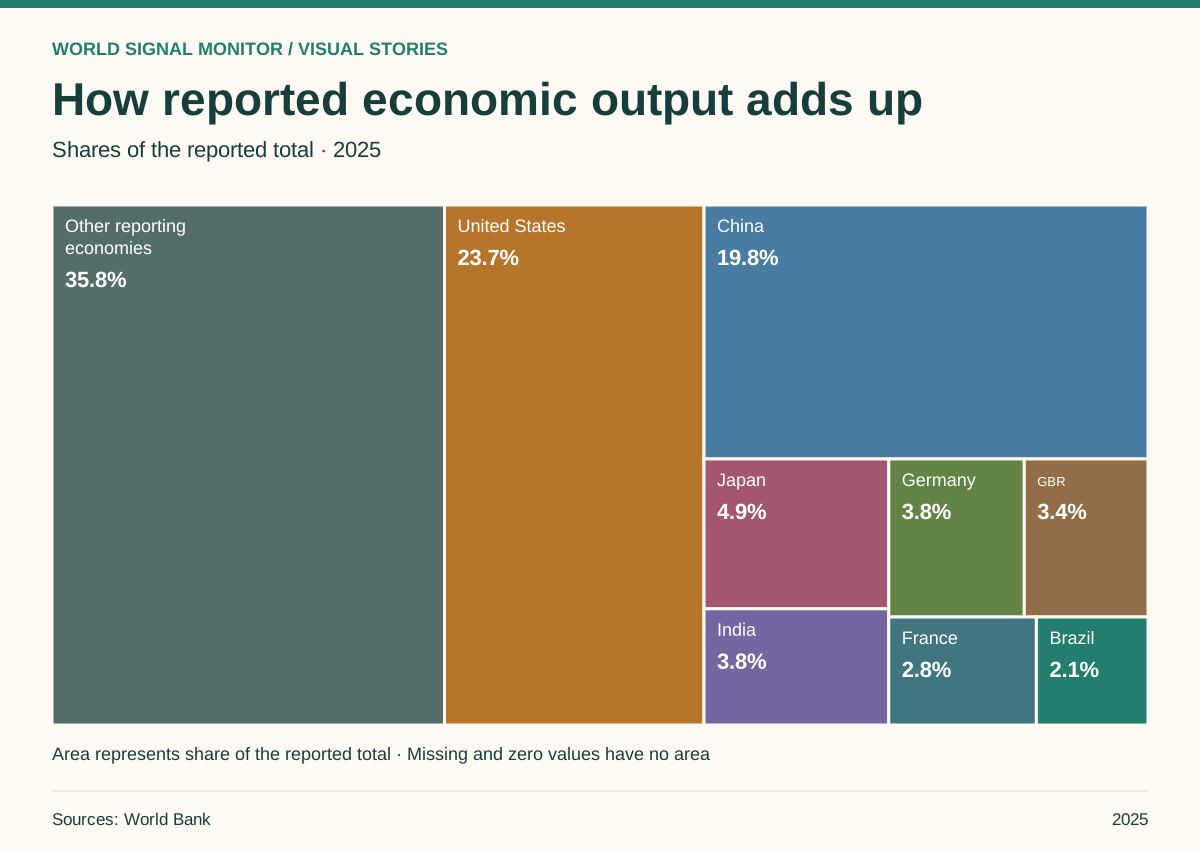
How reported economic output adds up
Compare the eight largest reported values with all other reporting economies combined.
Explore the story →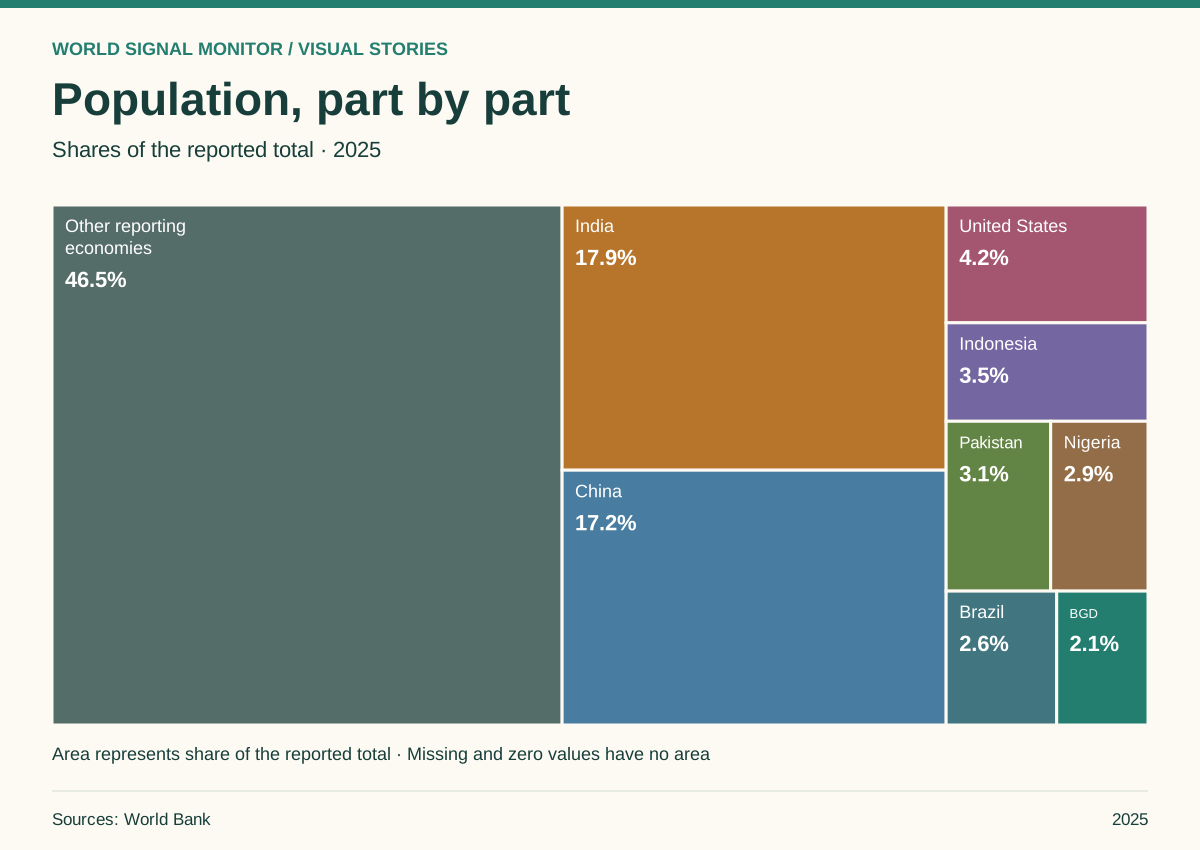
Population, part by part
Compare the eight largest reported values with all other reporting economies combined.
Explore the story →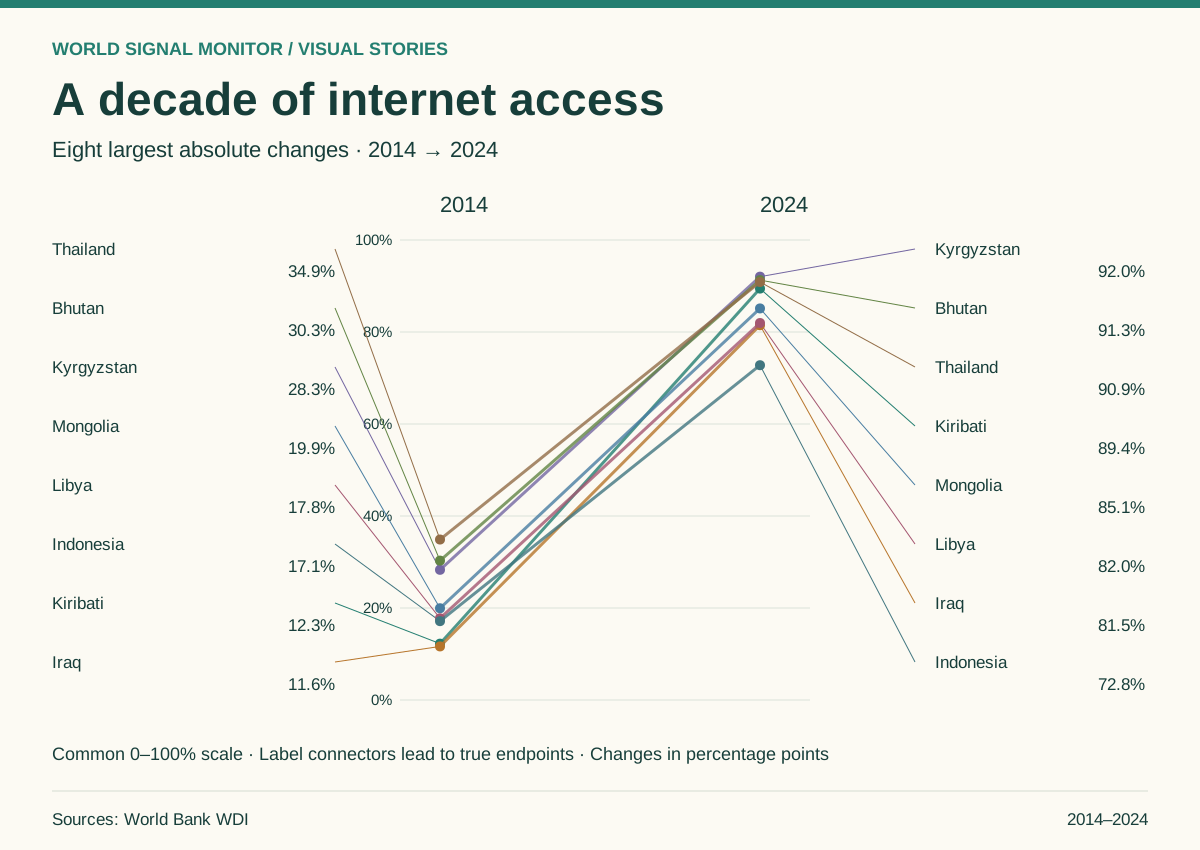
A decade of internet access
179 economies have both endpoints. The graphic highlights eight with the largest absolute percentage-point changes.
Explore the story →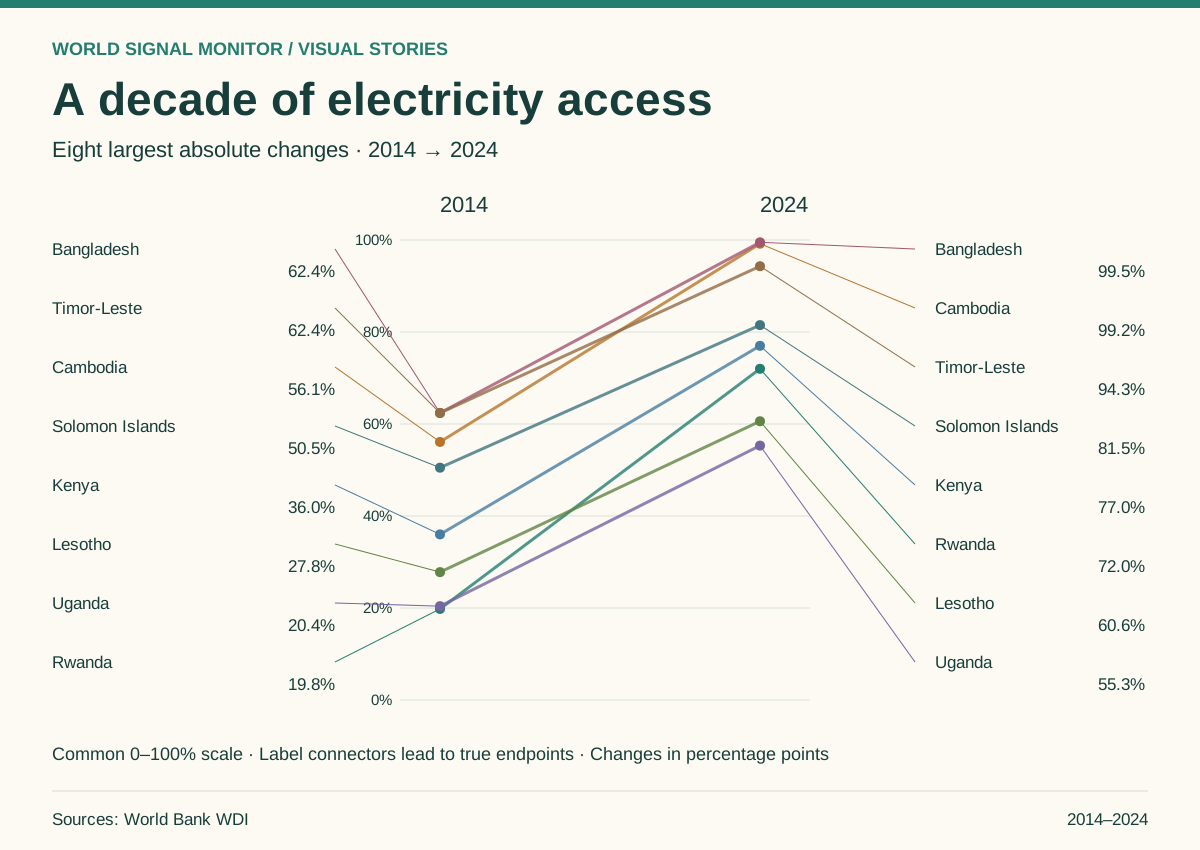
A decade of electricity access
215 economies have both endpoints. The graphic highlights eight with the largest absolute percentage-point changes.
Explore the story →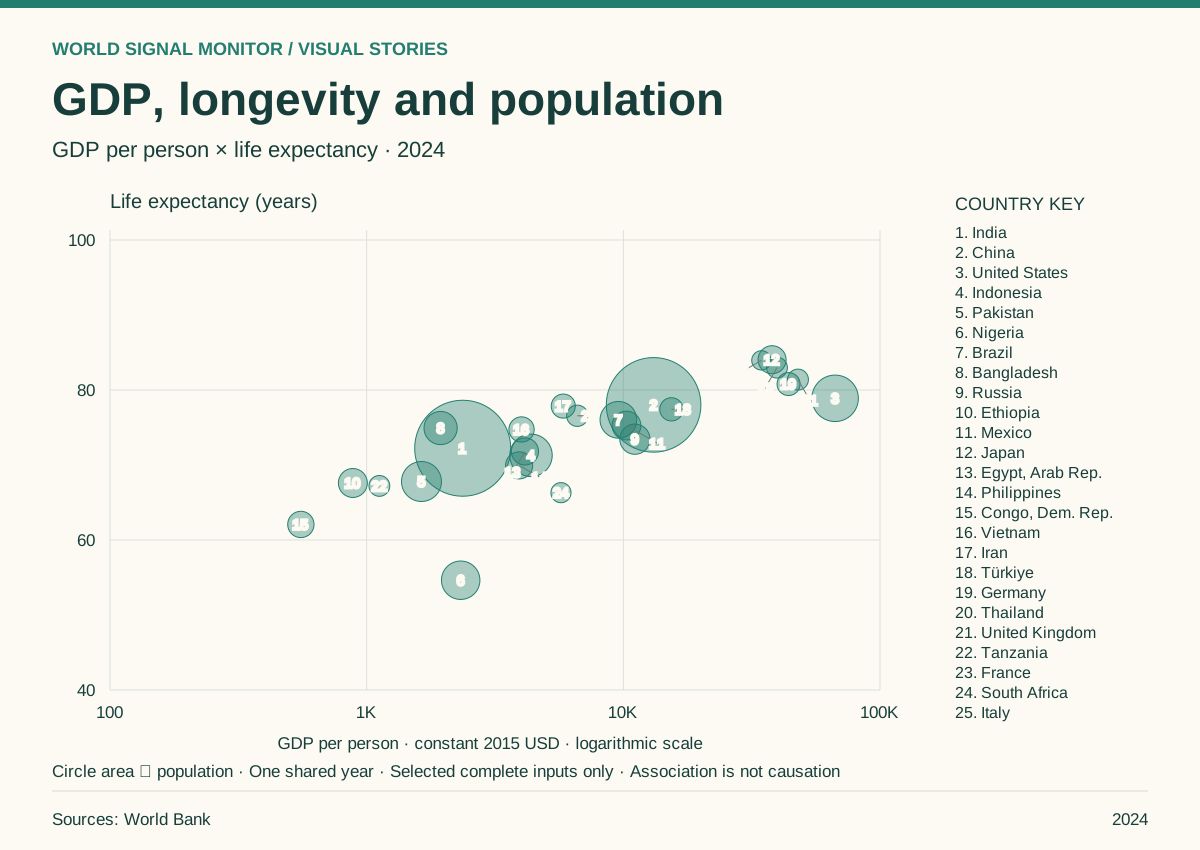
GDP, longevity and population
The 25 largest populations among 199 economies with complete comparable inputs. Circle area represents population.
Explore the story →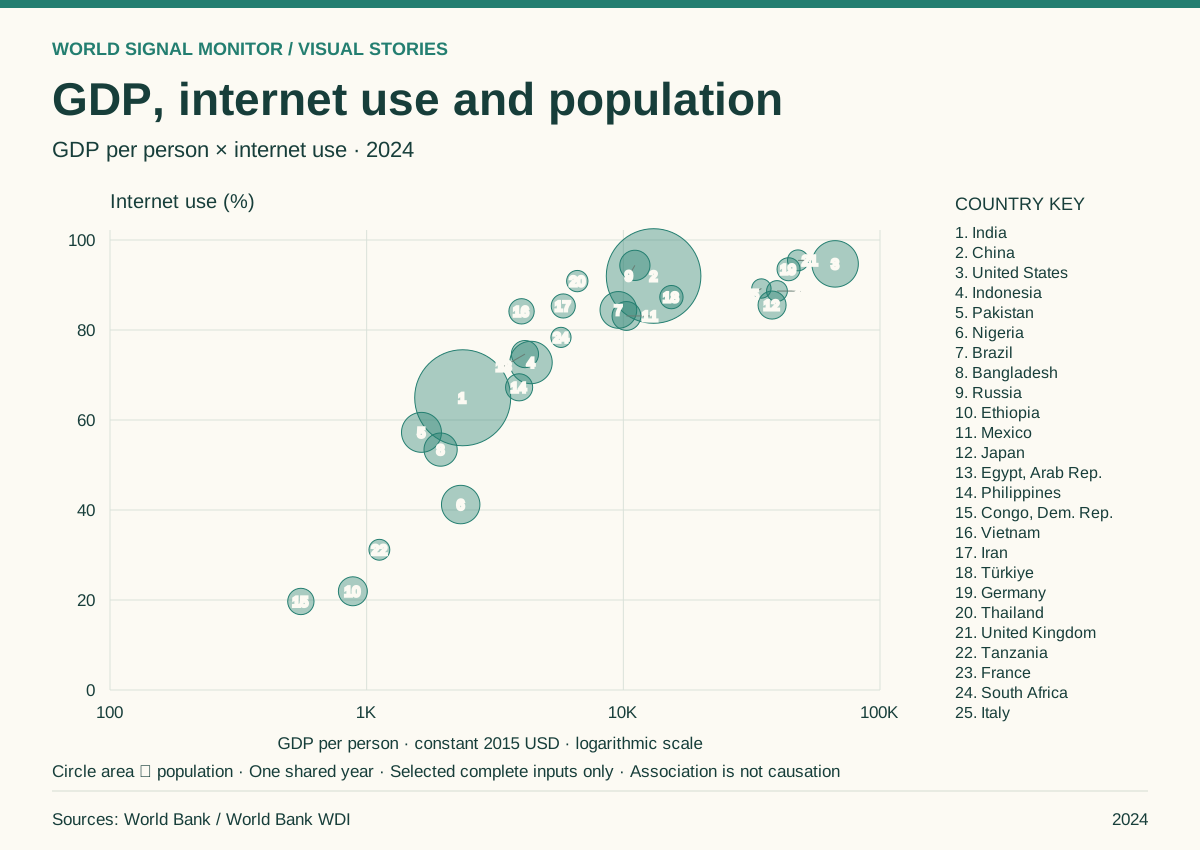
GDP, internet use and population
The 25 largest populations among 180 economies with complete comparable inputs. Circle area represents population.
Explore the story →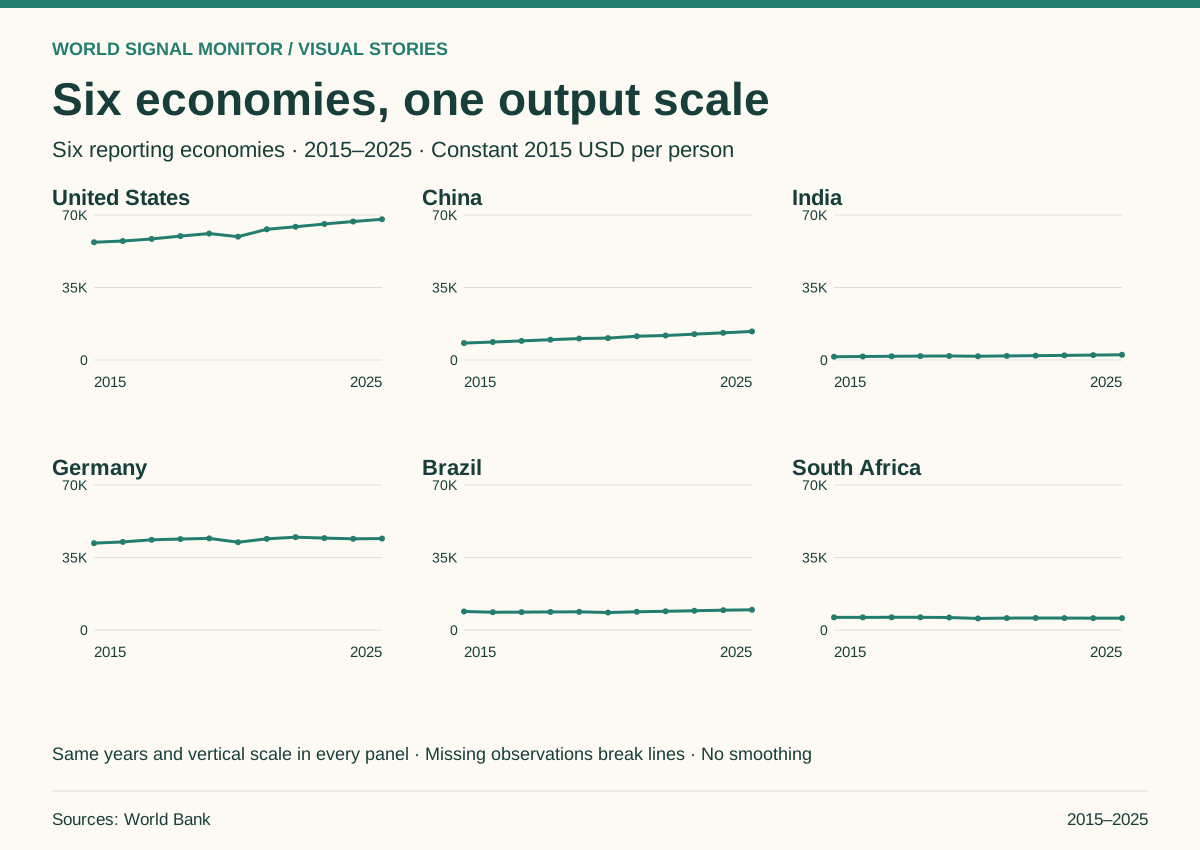
Six economies, one output scale
Separate country panels share the same years and vertical scale, so levels and changes can be compared directly.
Explore the story →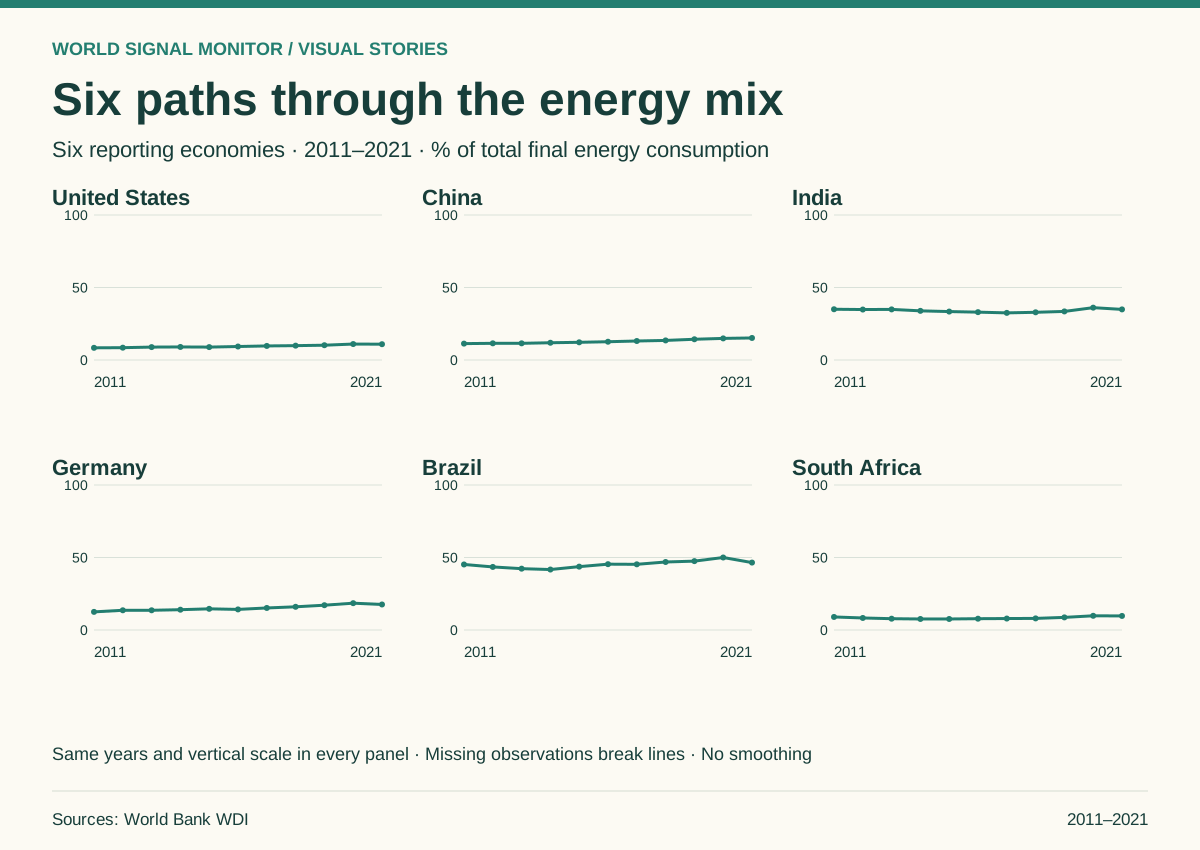
Six paths through the energy mix
Separate country panels share the same years and vertical scale, so levels and changes can be compared directly.
Explore the story →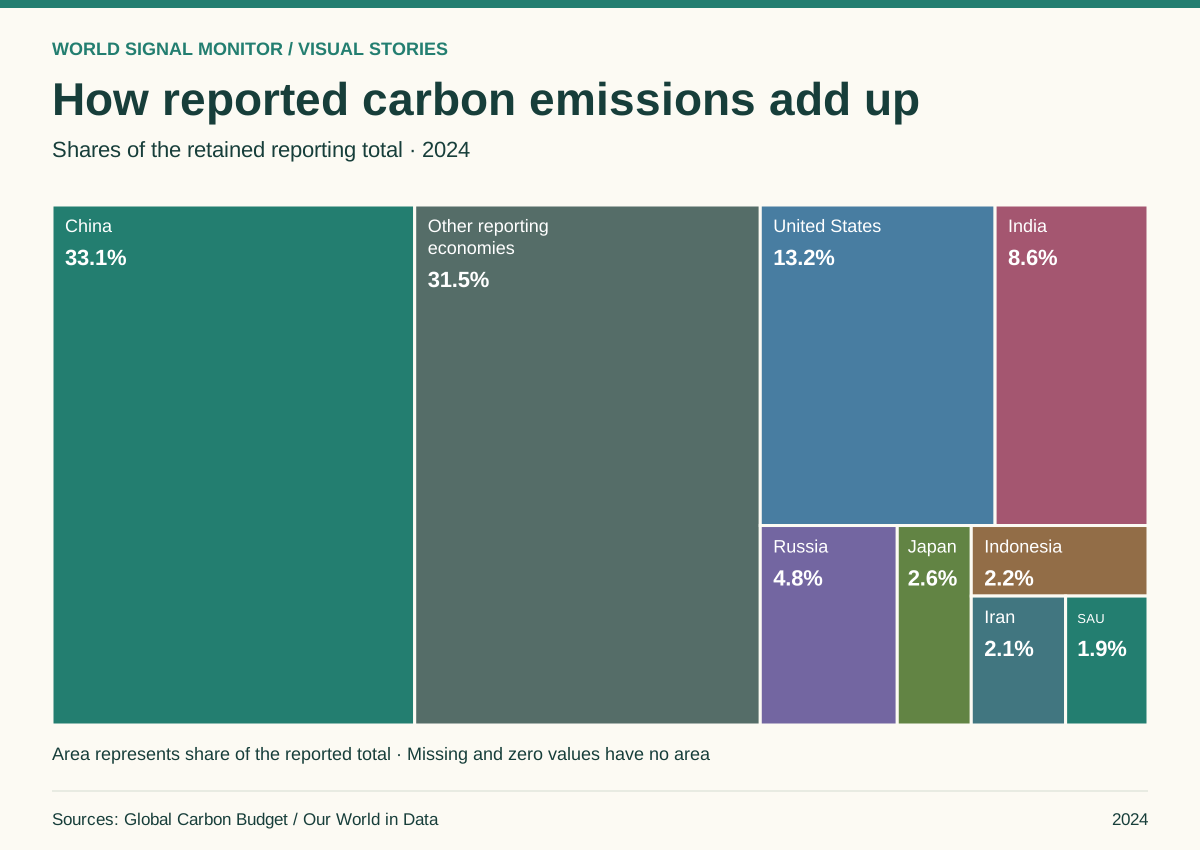
How reported carbon emissions add up
8 leading reporting economies and the remaining retained values, with rectangle area proportional to value.
Explore the story →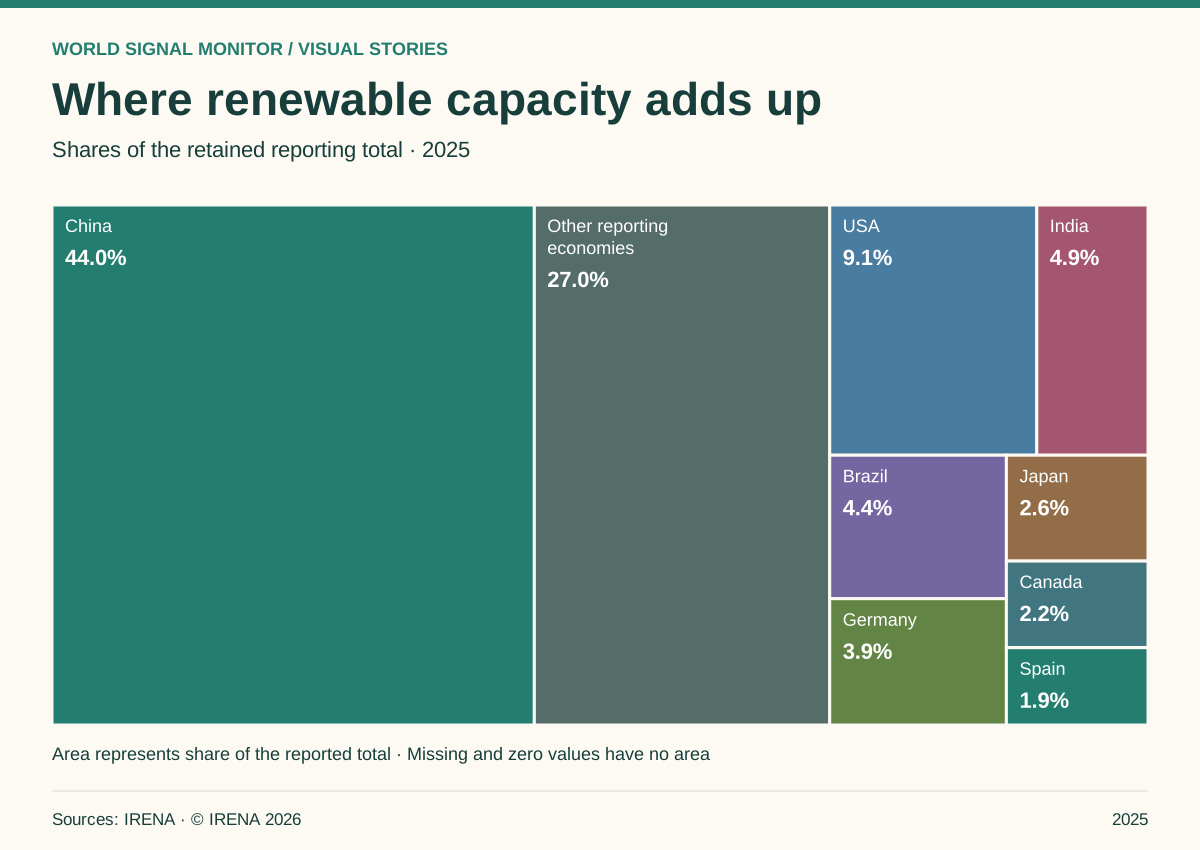
Where renewable capacity adds up
8 leading reporting economies and the remaining retained values, with rectangle area proportional to value.
Explore the story →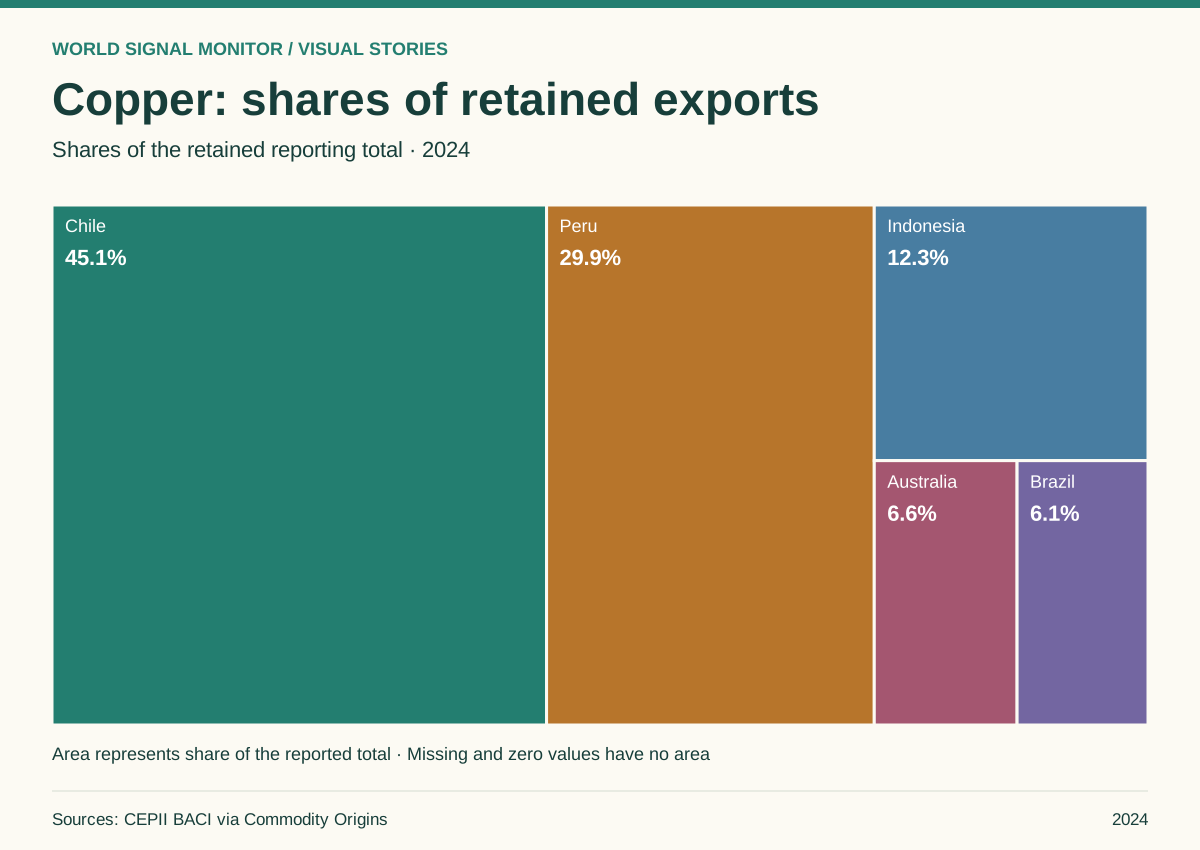
Copper: shares of retained exports
5 leading reporting economies, with rectangle area proportional to value.
Explore the story →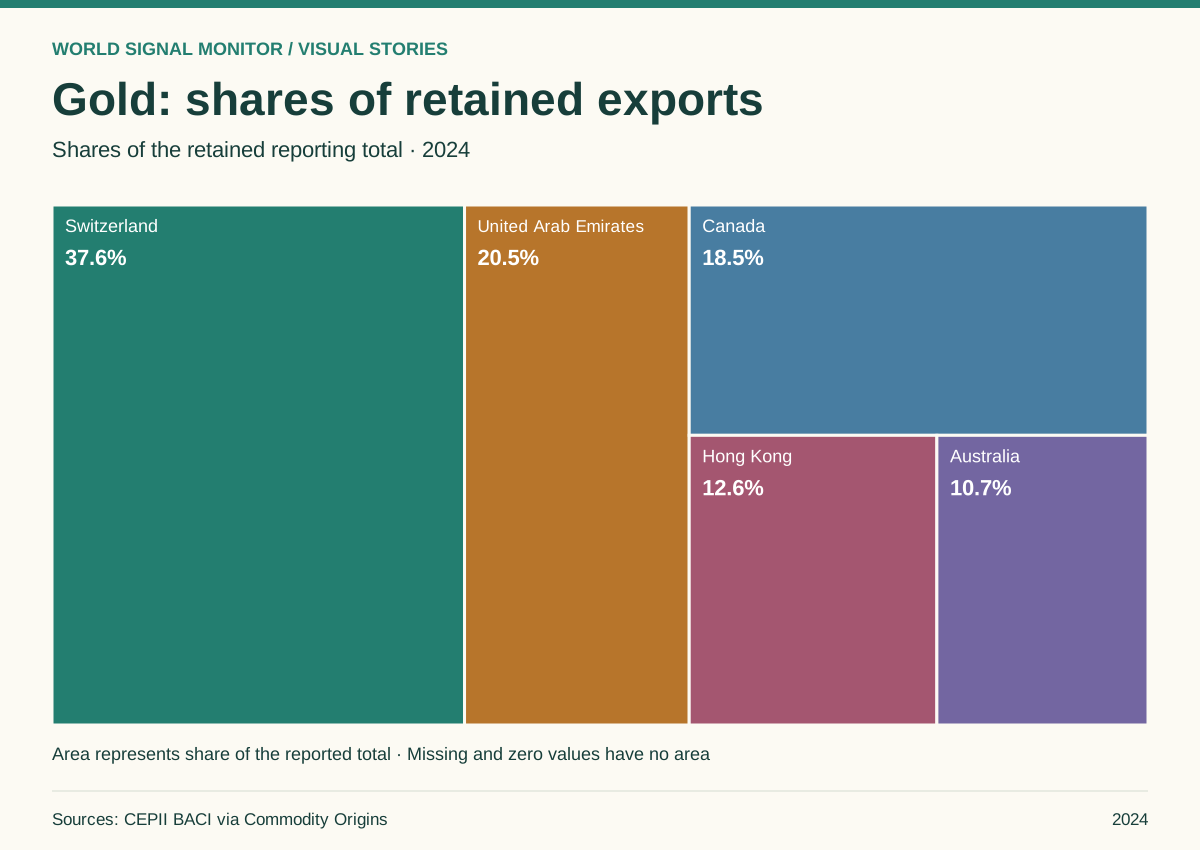
Gold: shares of retained exports
5 leading reporting economies, with rectangle area proportional to value.
Explore the story →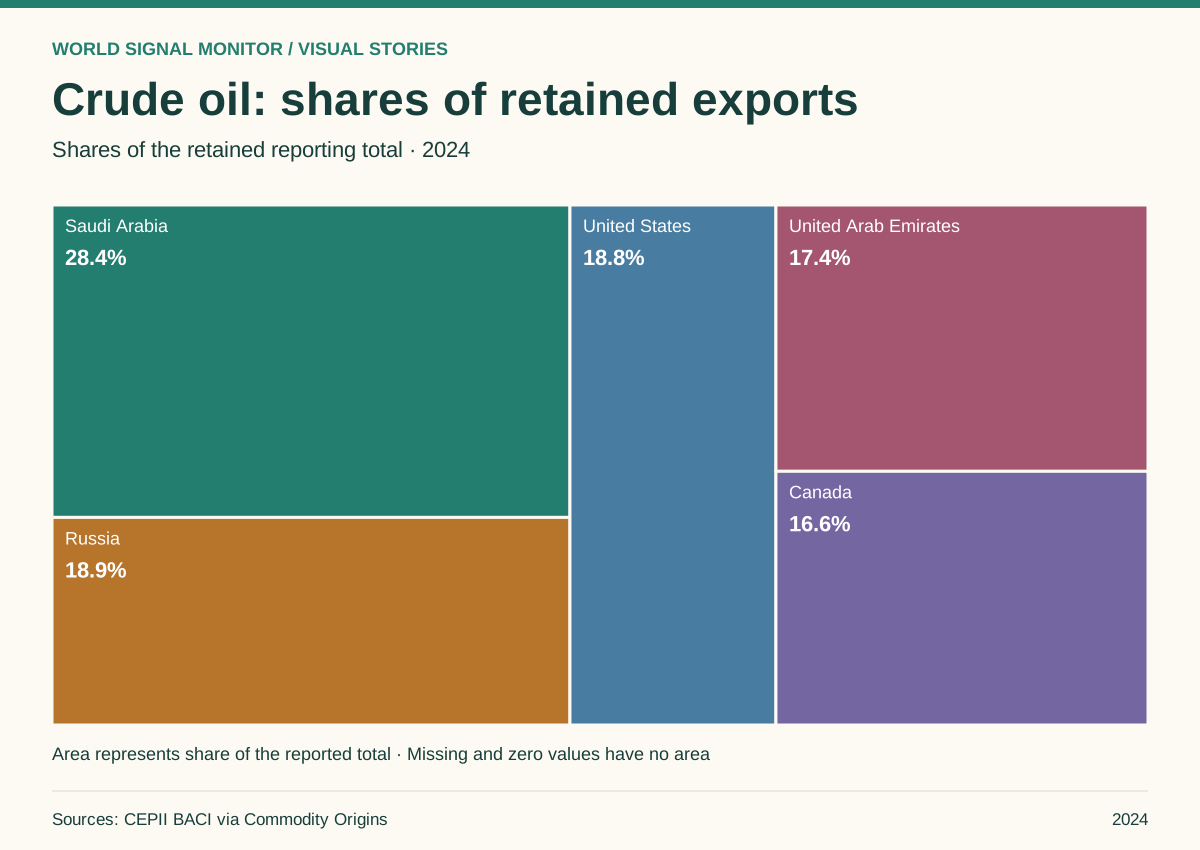
Crude oil: shares of retained exports
5 leading reporting economies, with rectangle area proportional to value.
Explore the story →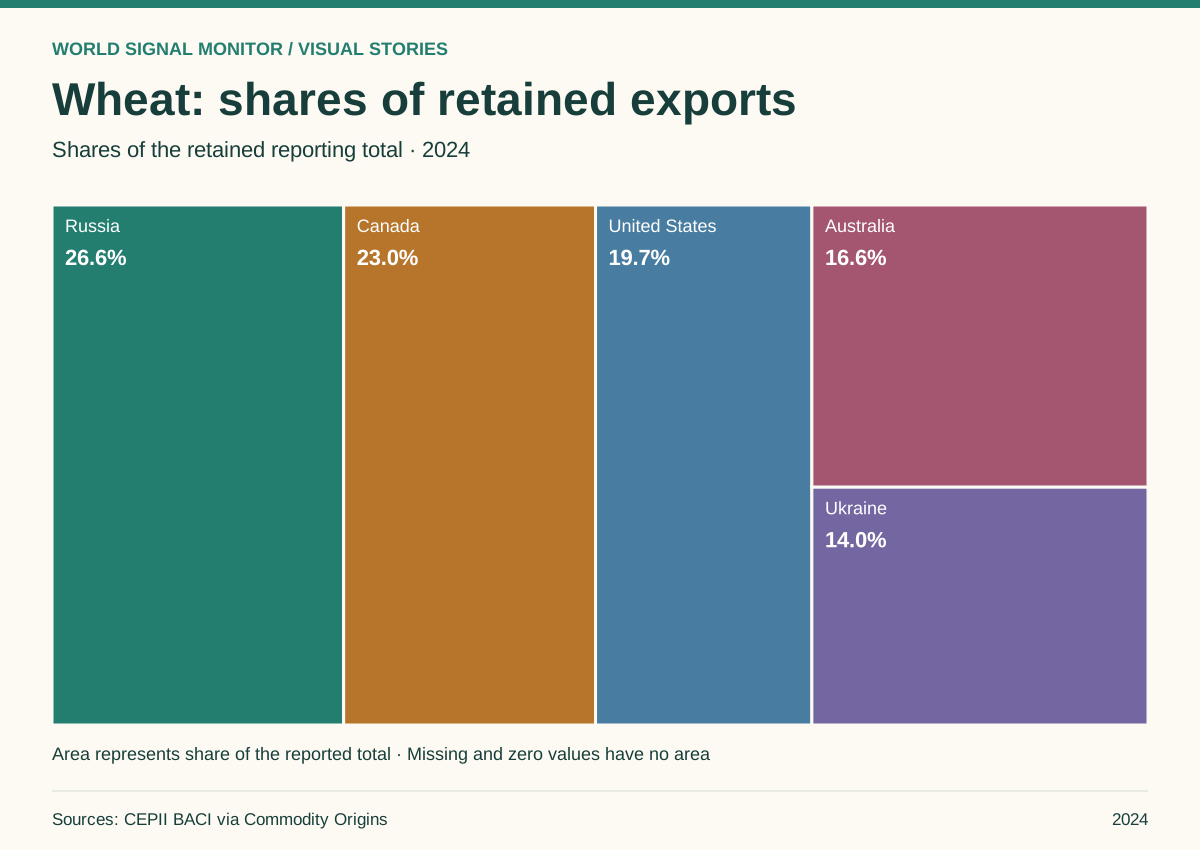
Wheat: shares of retained exports
5 leading reporting economies, with rectangle area proportional to value.
Explore the story →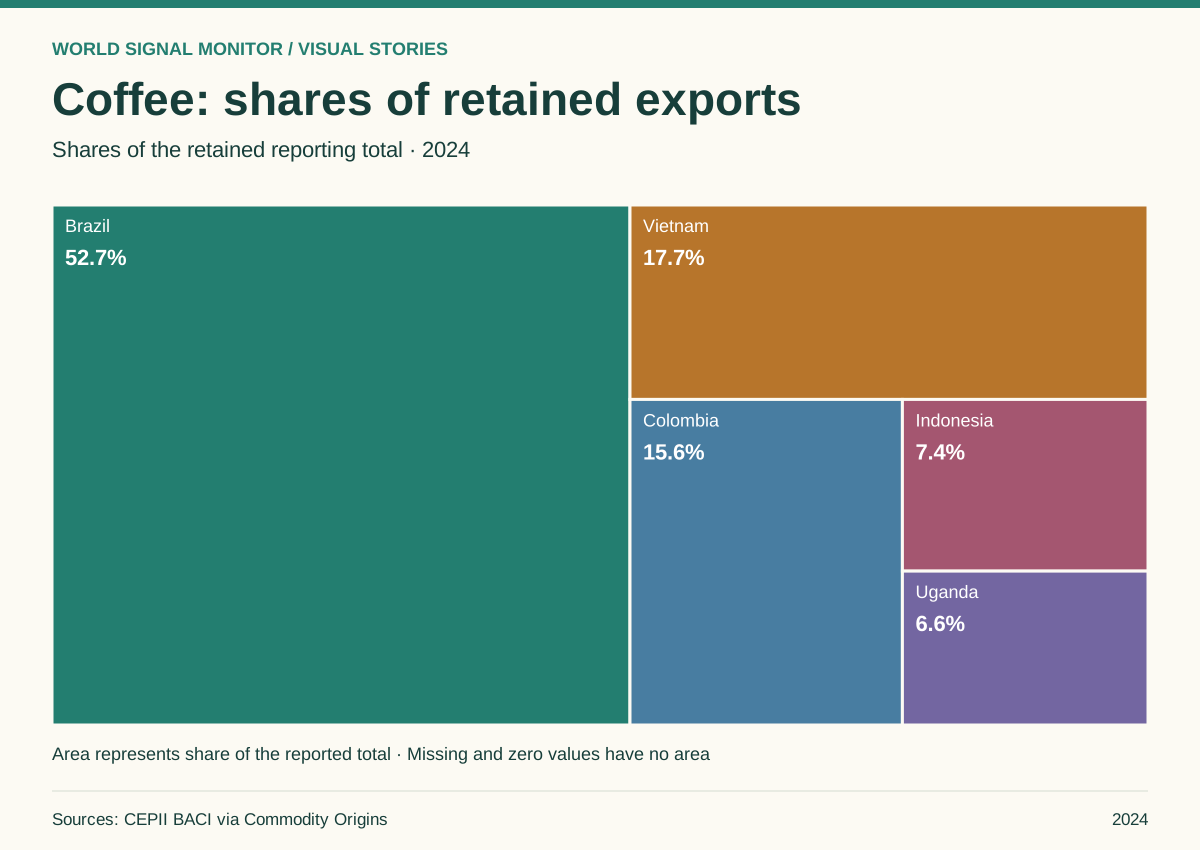
Coffee: shares of retained exports
5 leading reporting economies, with rectangle area proportional to value.
Explore the story →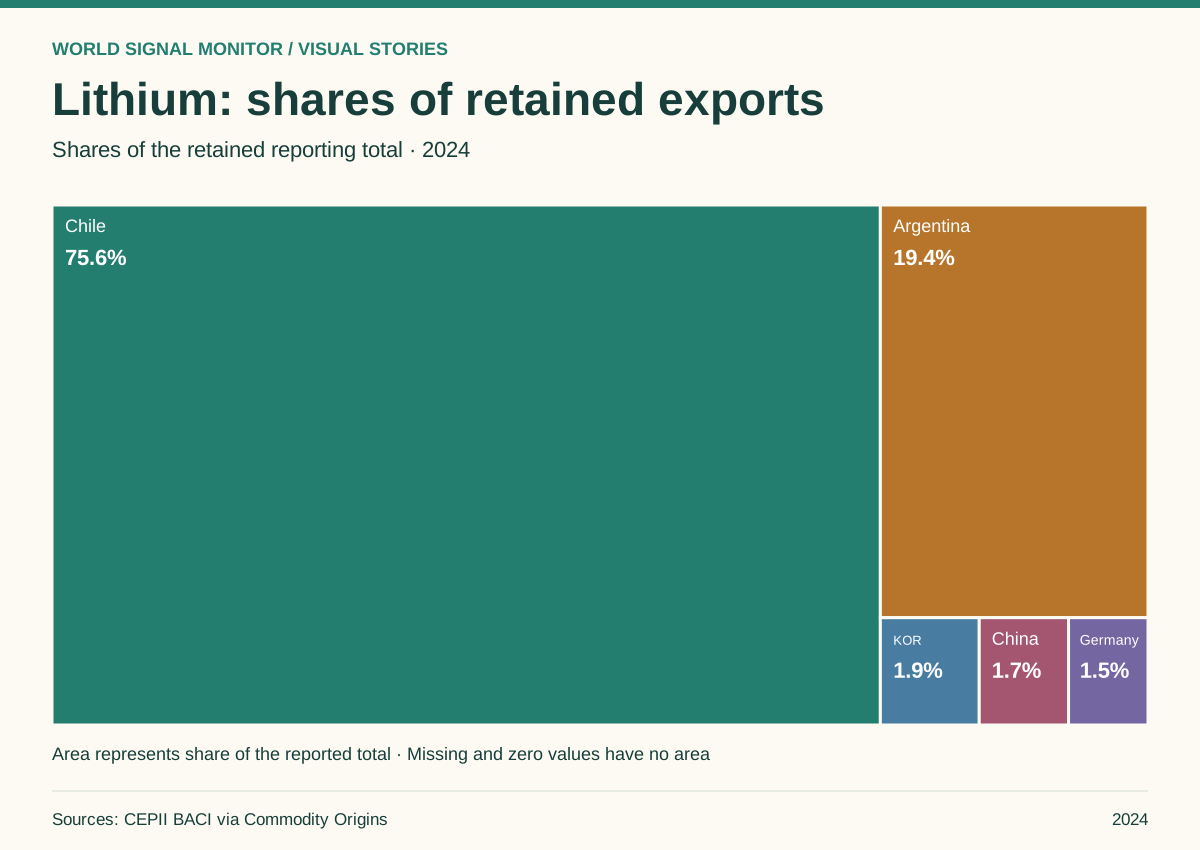
Lithium: shares of retained exports
5 leading reporting economies, with rectangle area proportional to value.
Explore the story →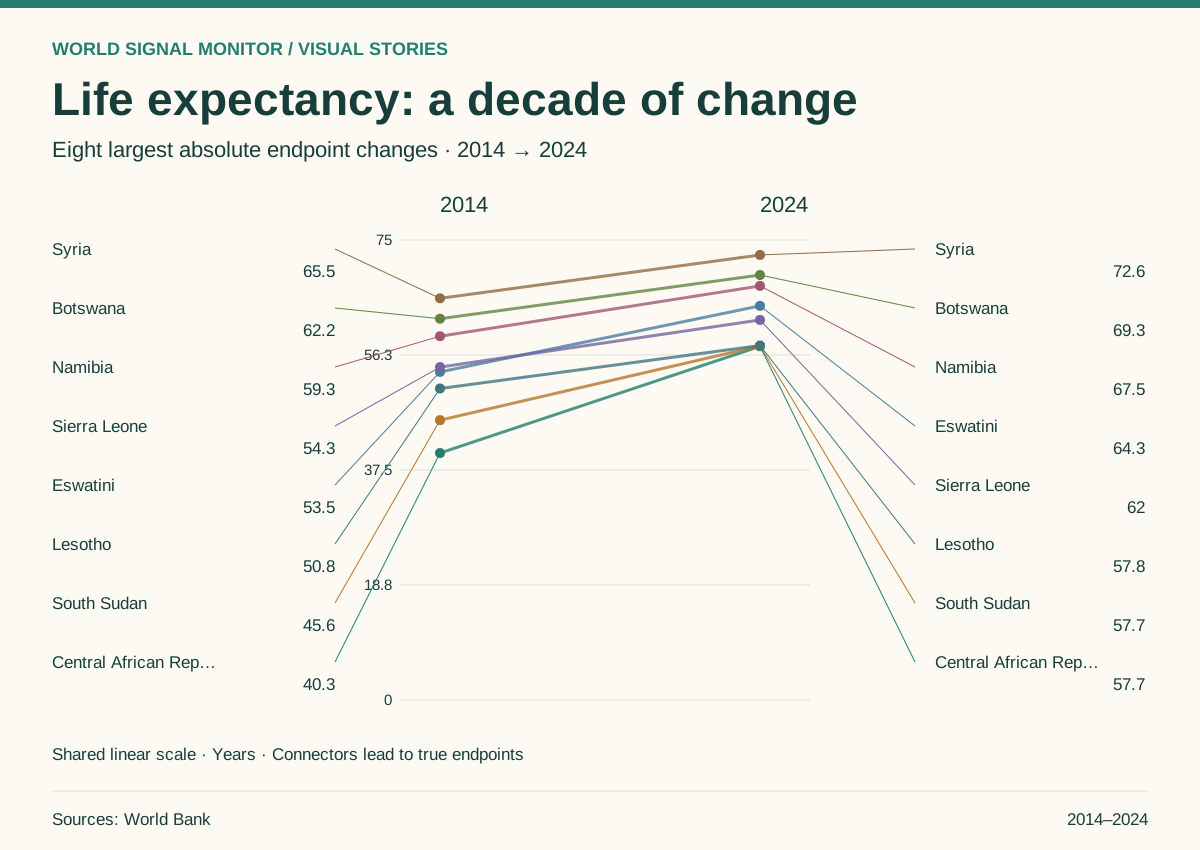
Life expectancy: a decade of change
217 economies have both endpoints. Eight of the largest absolute changes are highlighted; changes are measured in Years.
Explore the story →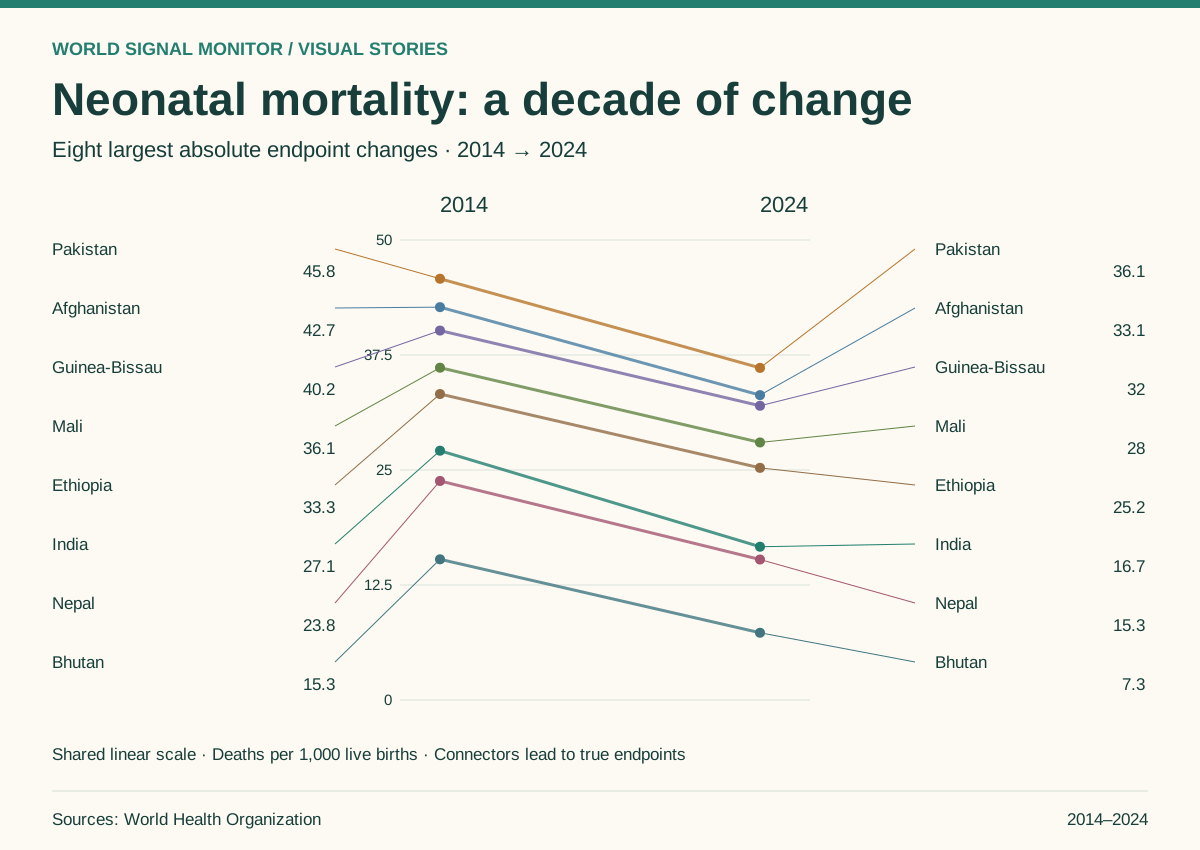
Neonatal mortality: a decade of change
196 economies have both endpoints. Eight of the largest absolute changes are highlighted; changes are measured in Deaths per 1,000 live births.
Explore the story →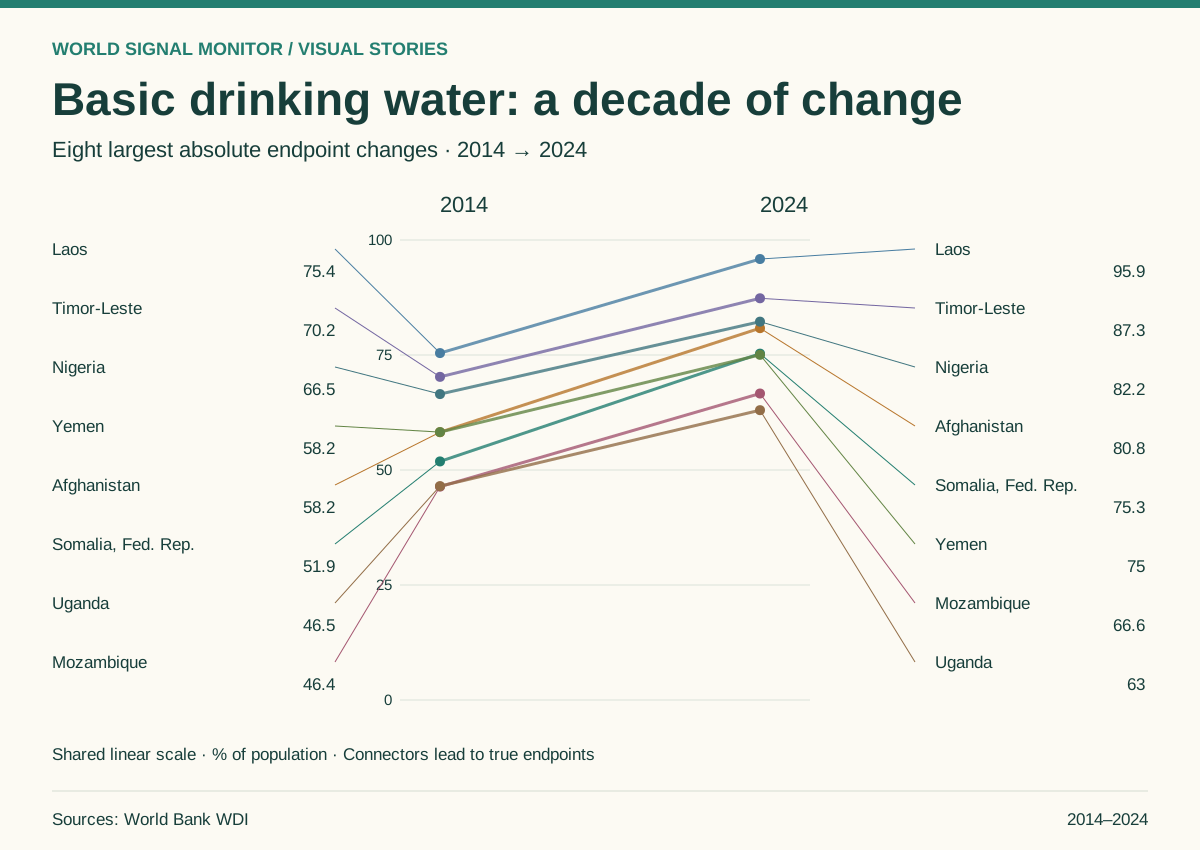
Basic drinking water: a decade of change
201 economies have both endpoints. Eight of the largest absolute changes are highlighted; changes are measured in percentage points.
Explore the story →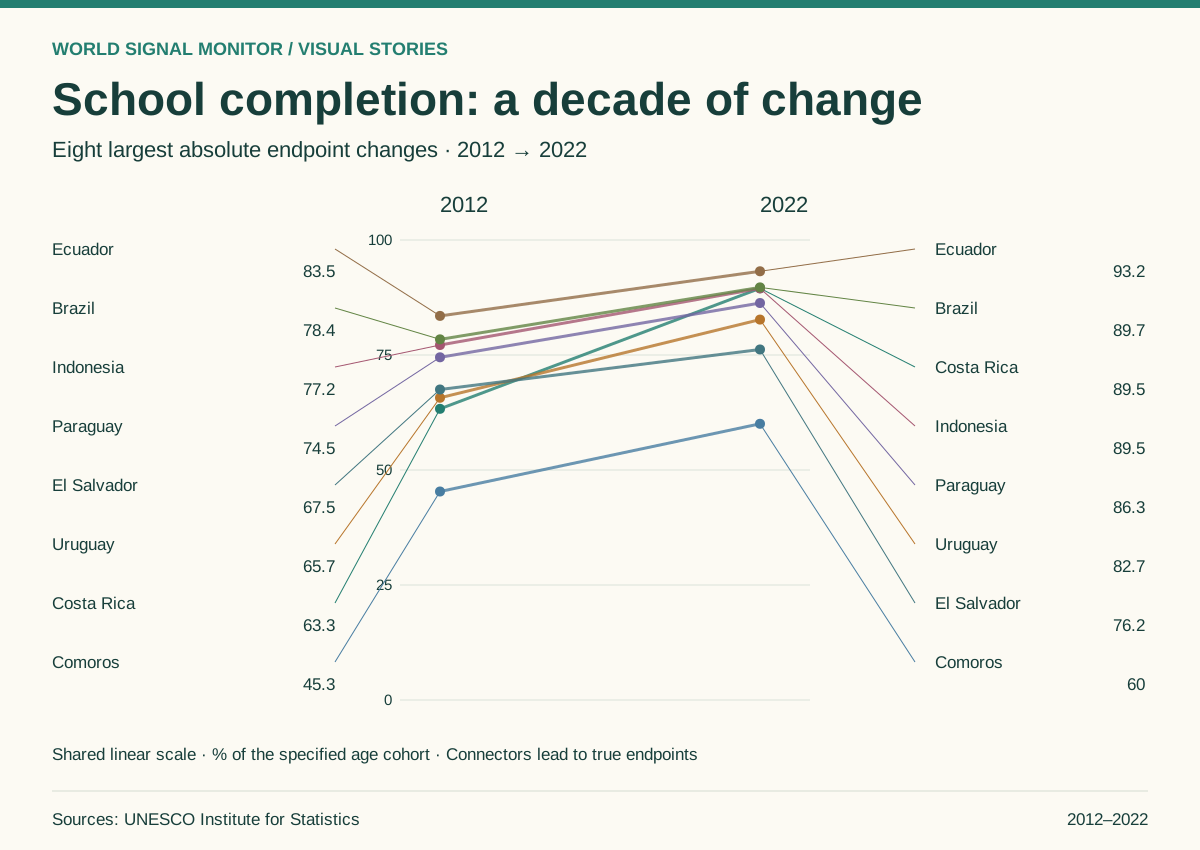
School completion: a decade of change
14 economies have both endpoints. Eight of the largest absolute changes are highlighted; changes are measured in percentage points.
Explore the story →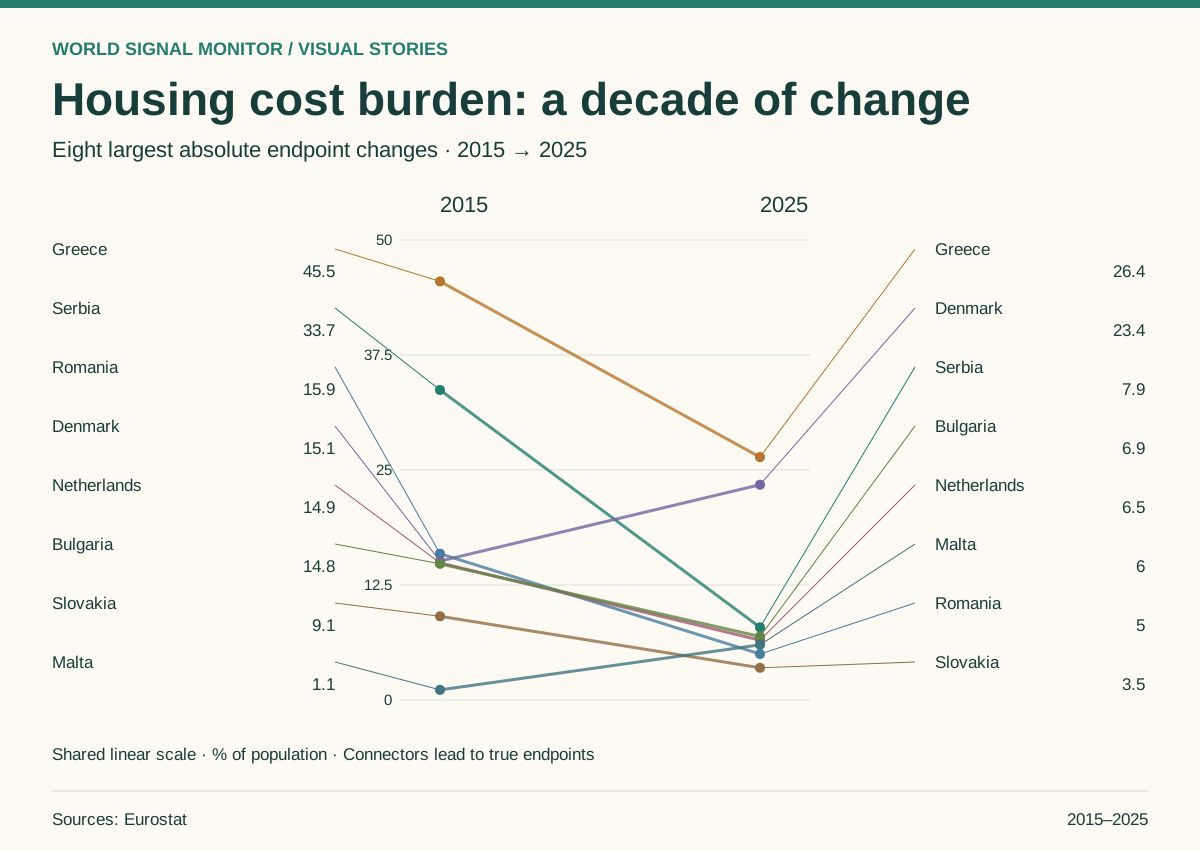
Housing cost burden: a decade of change
30 economies have both endpoints. Eight of the largest absolute changes are highlighted; changes are measured in percentage points.
Explore the story →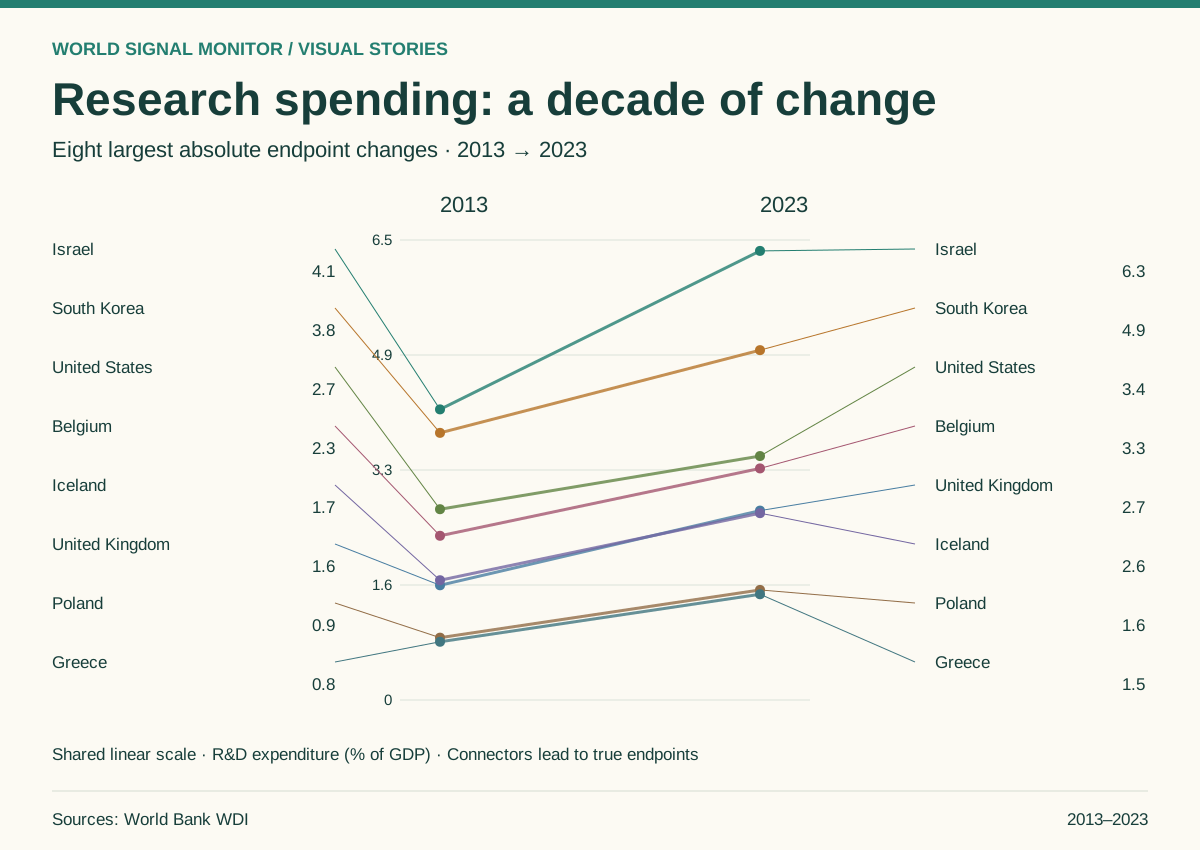
Research spending: a decade of change
71 economies have both endpoints. Eight of the largest absolute changes are highlighted; changes are measured in percentage points.
Explore the story →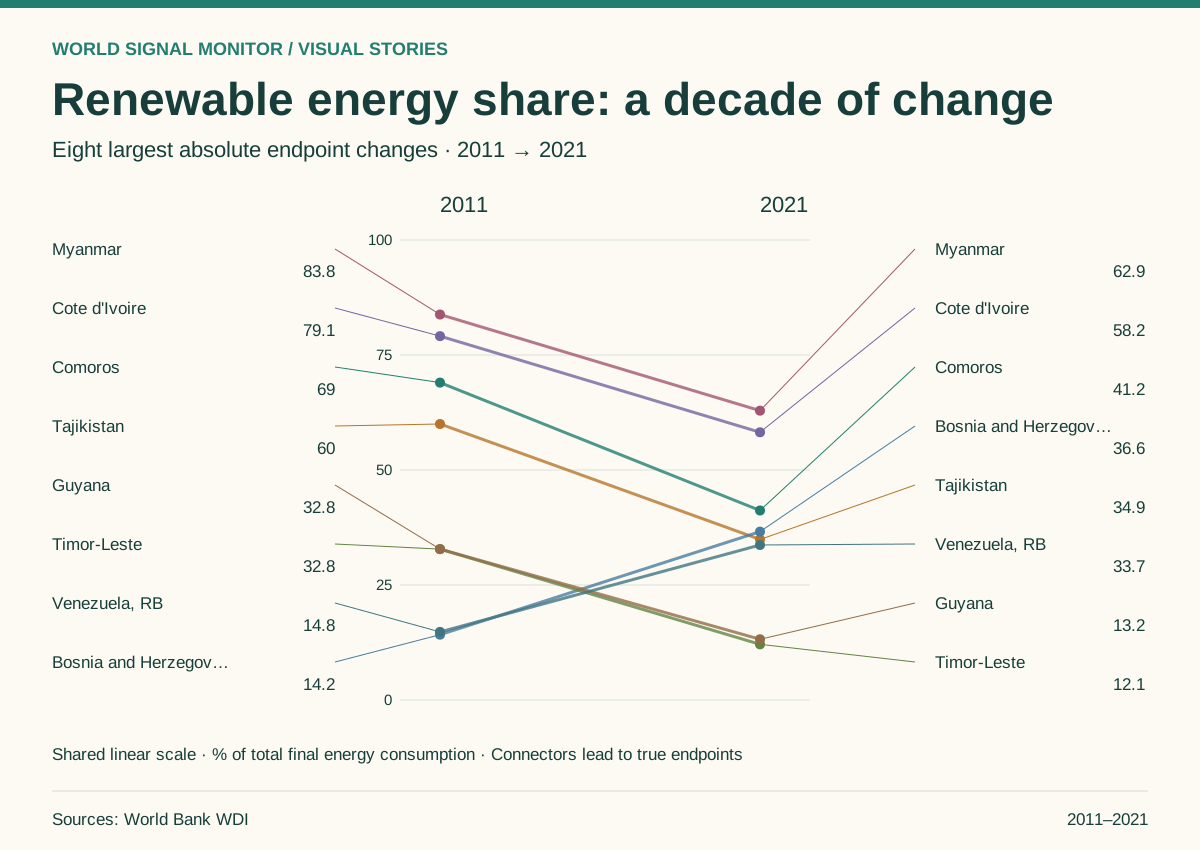
Renewable energy share: a decade of change
210 economies have both endpoints. Eight of the largest absolute changes are highlighted; changes are measured in percentage points.
Explore the story →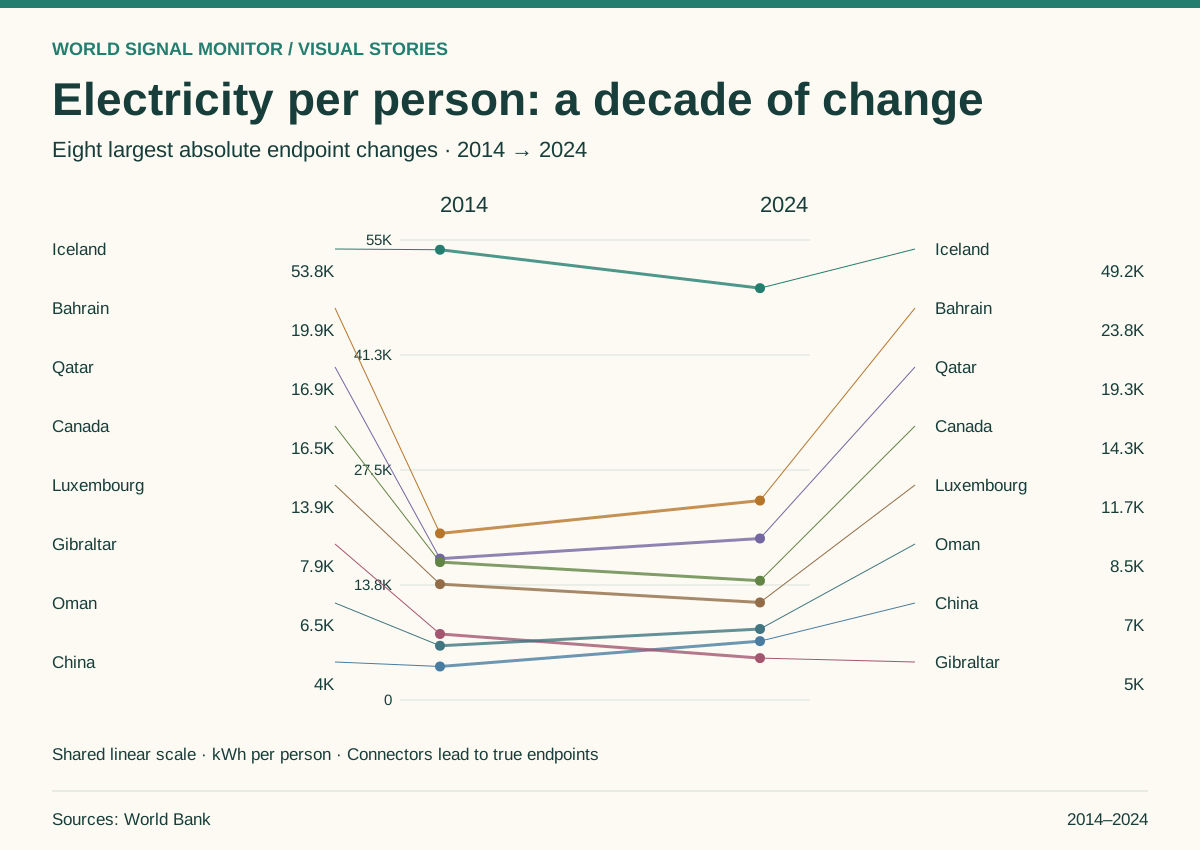
Electricity per person: a decade of change
149 economies have both endpoints. Eight of the largest absolute changes are highlighted; changes are measured in kWh per person.
Explore the story →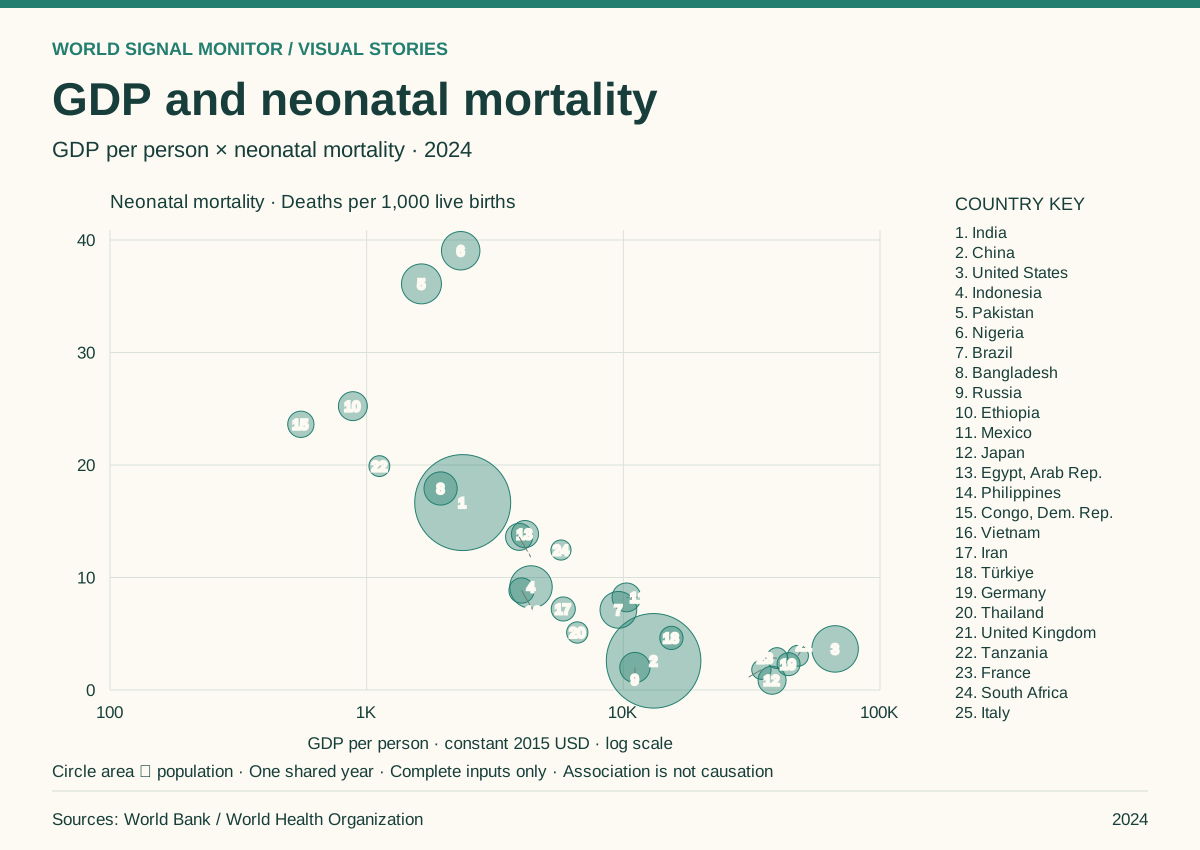
GDP and neonatal mortality
The 25 largest populations among 189 economies with complete inputs in one shared year. Circle area represents population.
Explore the story →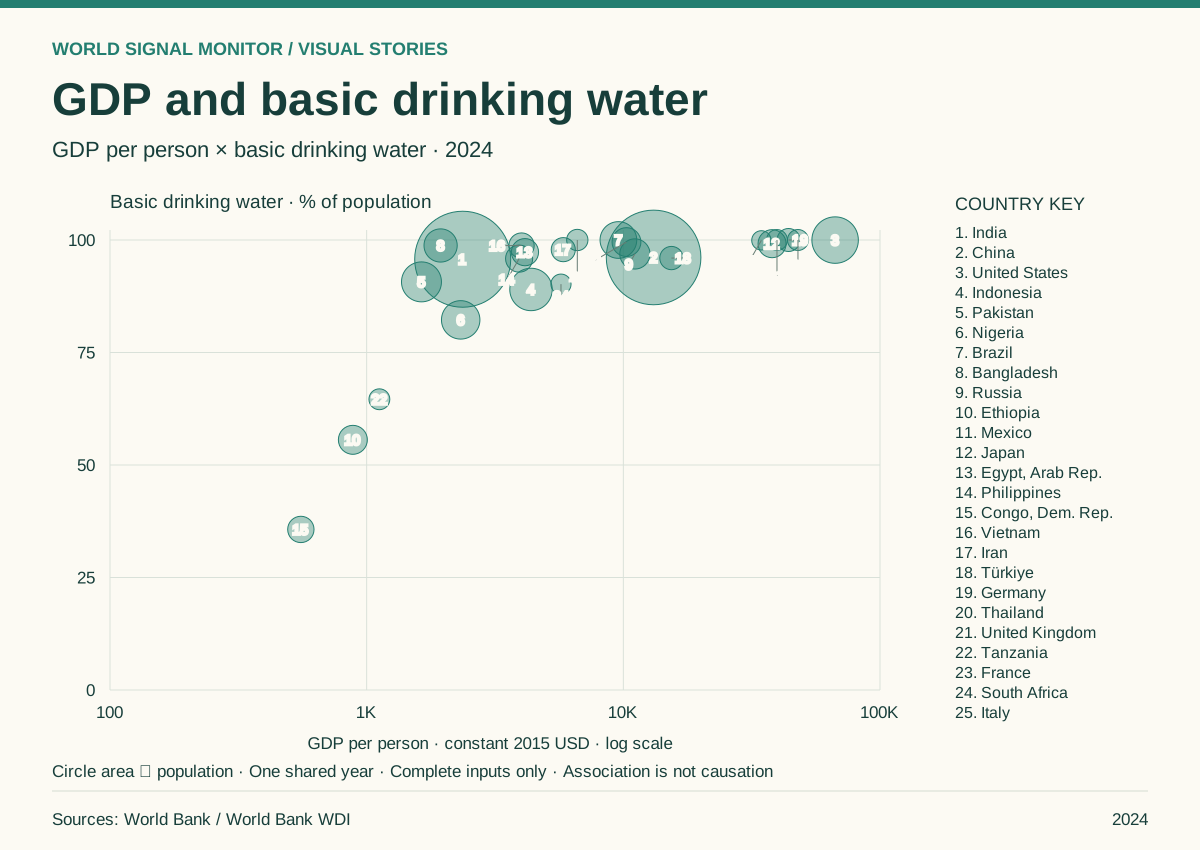
GDP and basic drinking water
The 25 largest populations among 187 economies with complete inputs in one shared year. Circle area represents population.
Explore the story →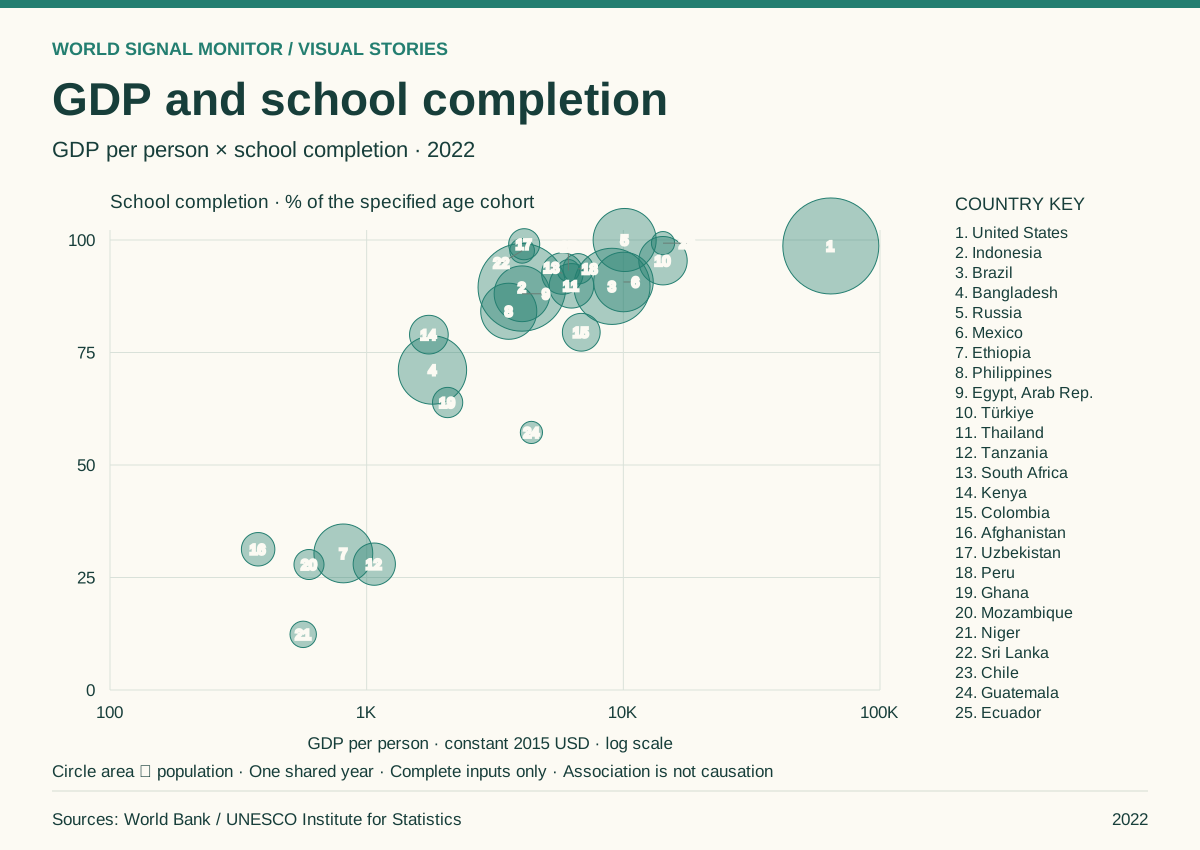
GDP and school completion
The 25 largest populations among 45 economies with complete inputs in one shared year. Circle area represents population.
Explore the story →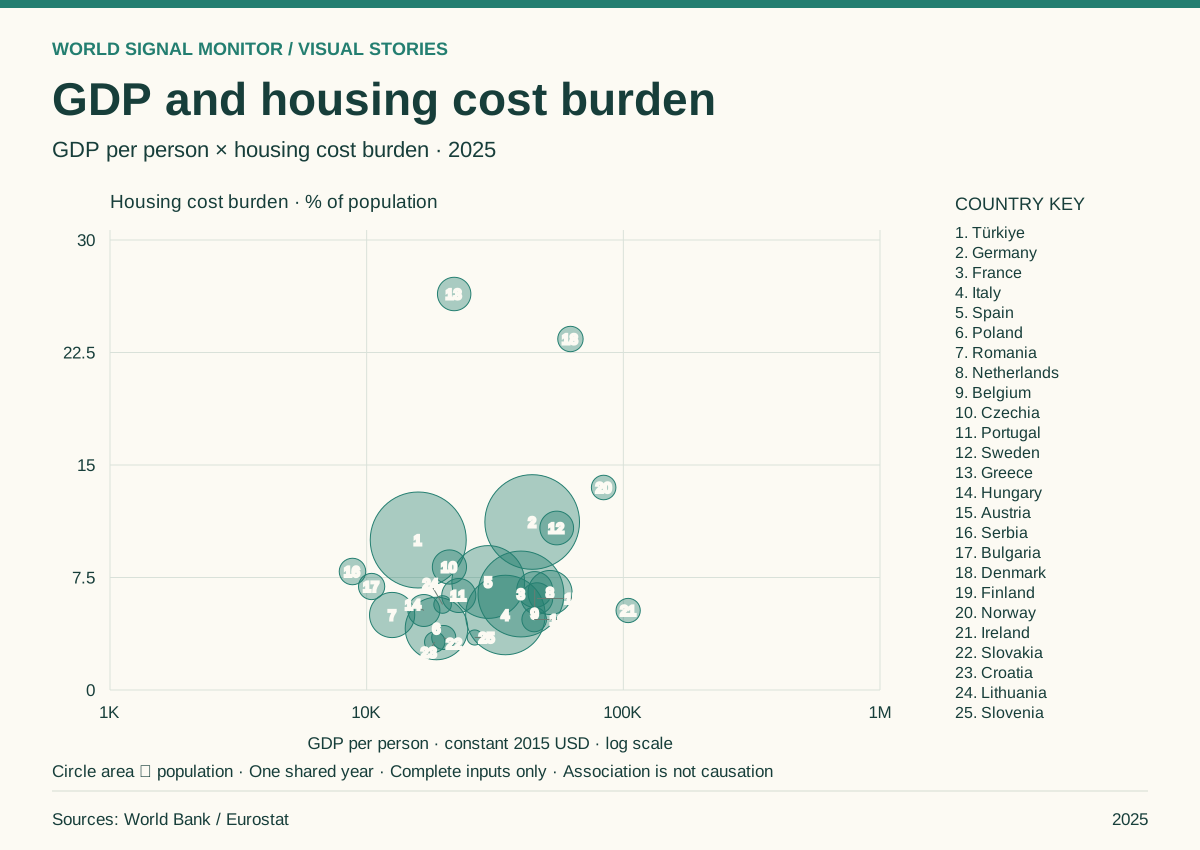
GDP and housing cost burden
The 25 largest populations among 30 economies with complete inputs in one shared year. Circle area represents population.
Explore the story →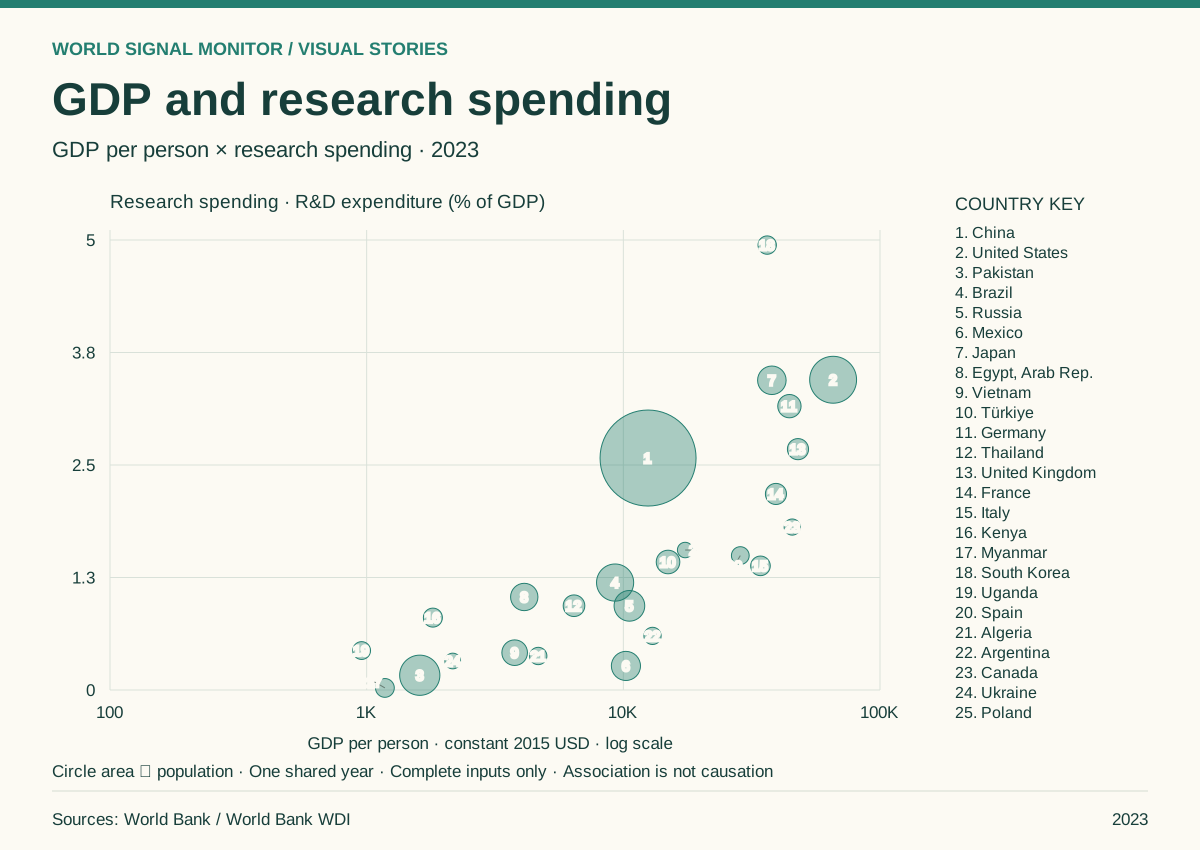
GDP and research spending
The 25 largest populations among 83 economies with complete inputs in one shared year. Circle area represents population.
Explore the story →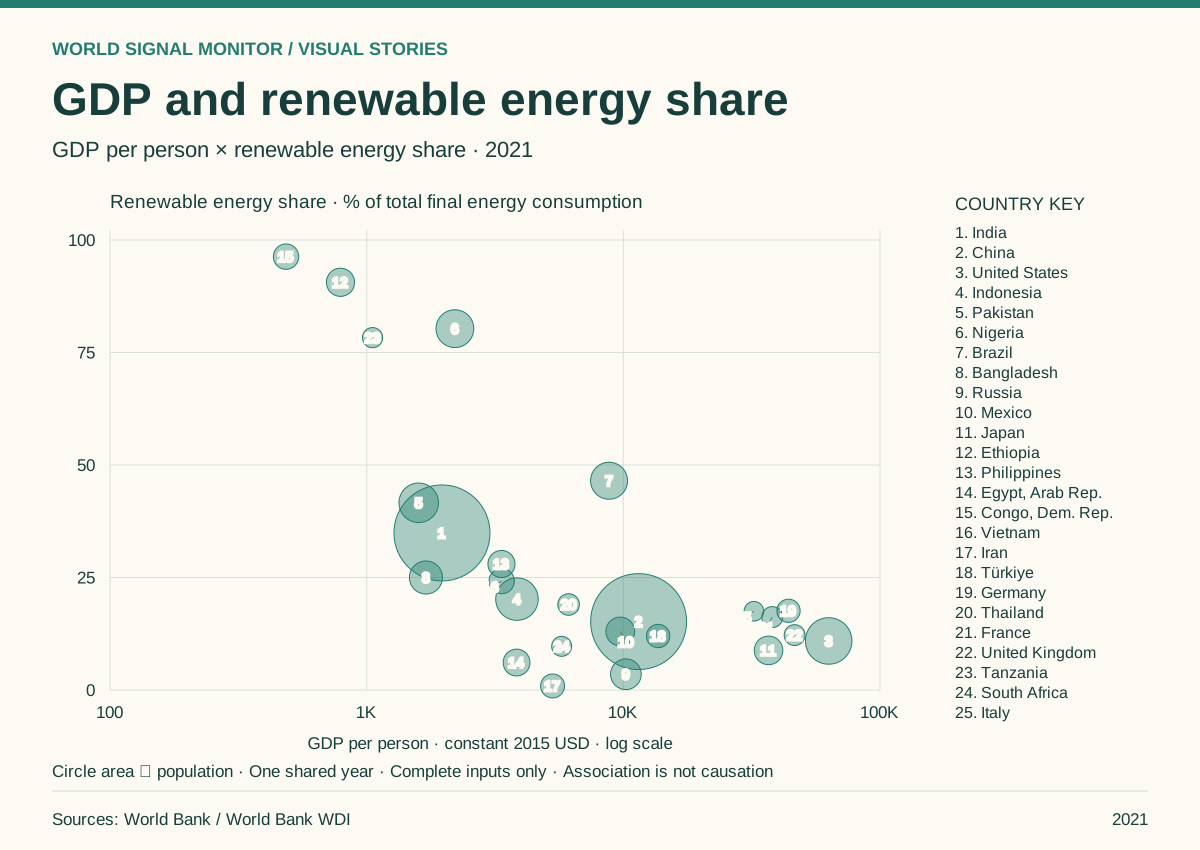
GDP and renewable energy share
The 25 largest populations among 204 economies with complete inputs in one shared year. Circle area represents population.
Explore the story →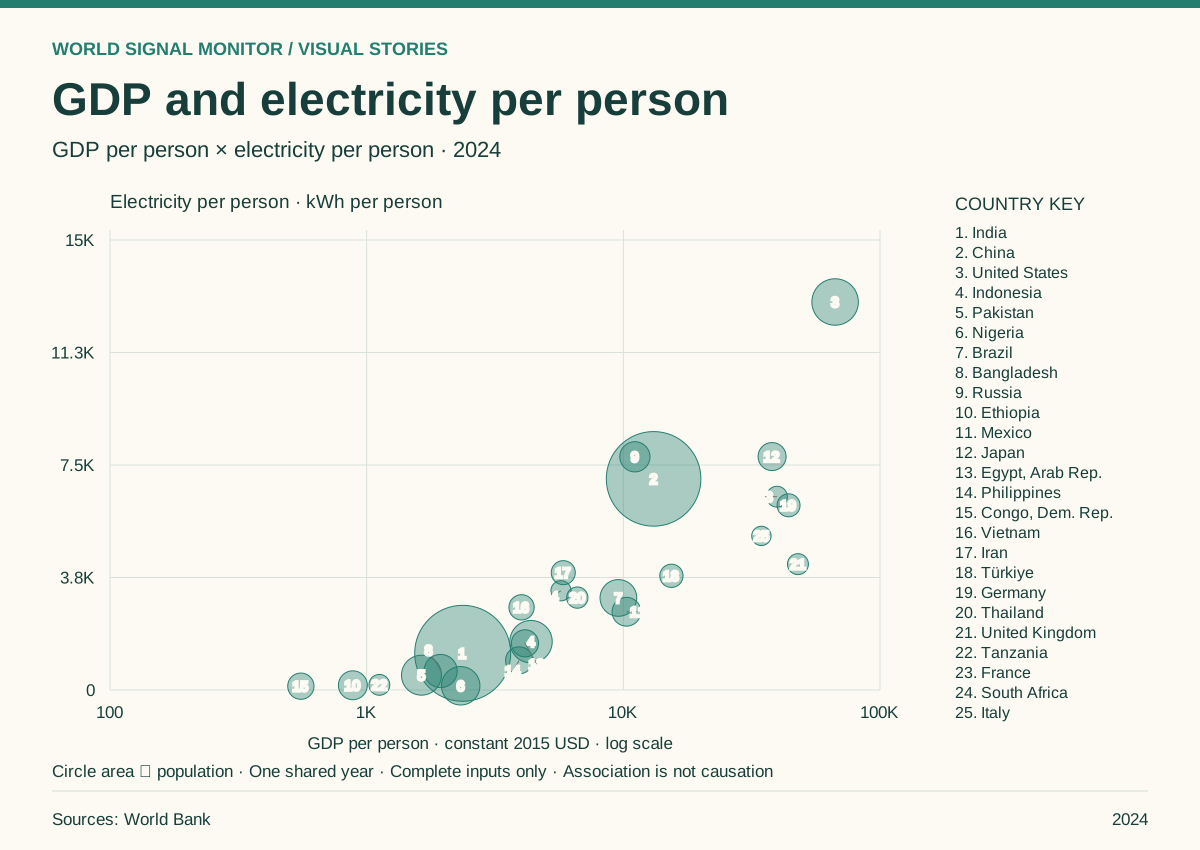
GDP and electricity per person
The 25 largest populations among 143 economies with complete inputs in one shared year. Circle area represents population.
Explore the story →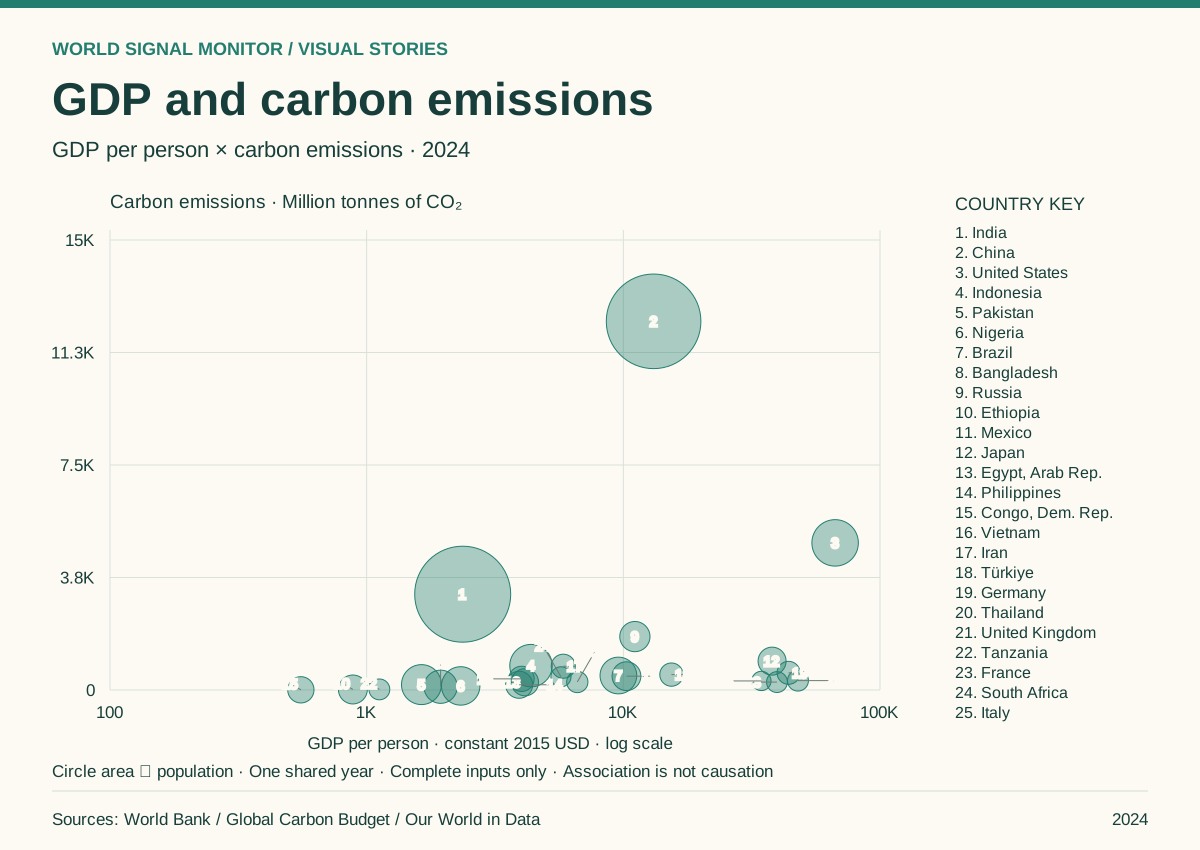
GDP and carbon emissions
The 25 largest populations among 195 economies with complete inputs in one shared year. Circle area represents population.
Explore the story →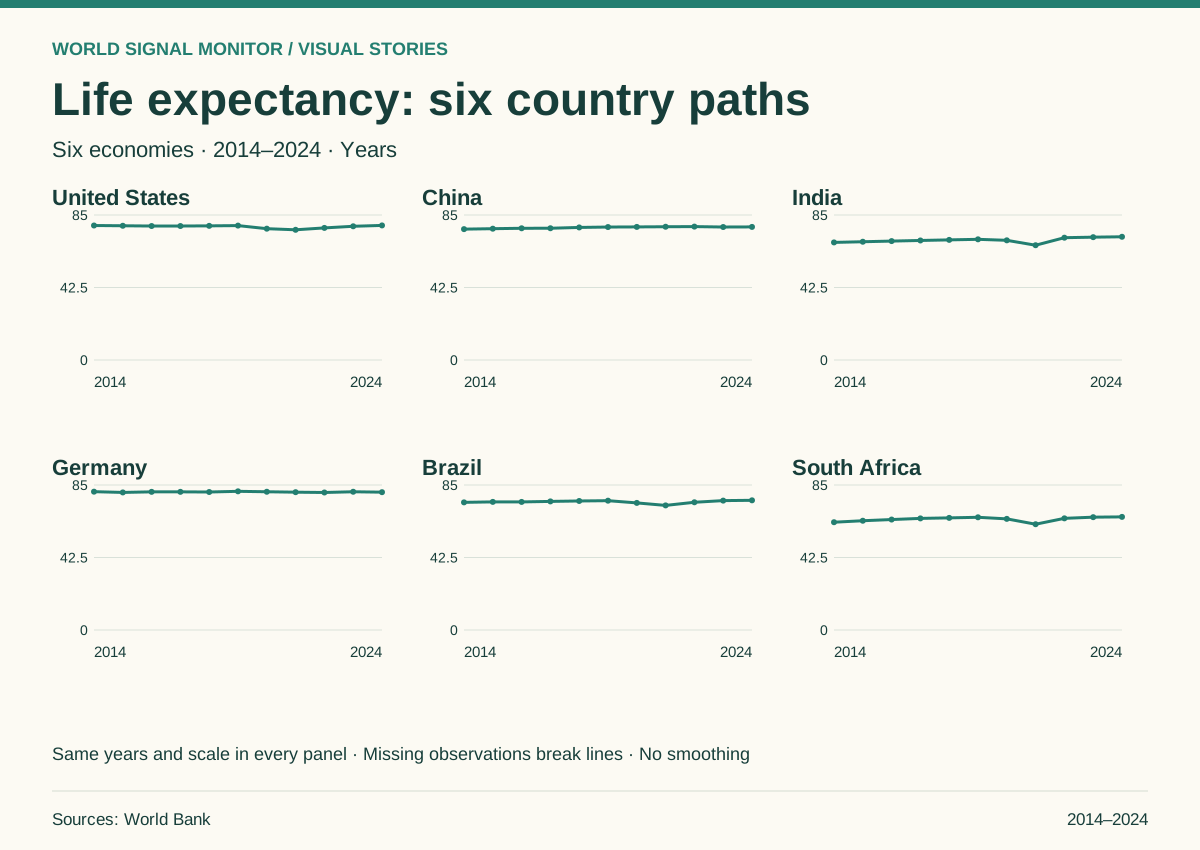
Life expectancy: six country paths
Compare country levels and changes using the same years and one shared vertical scale across all six panels.
Explore the story →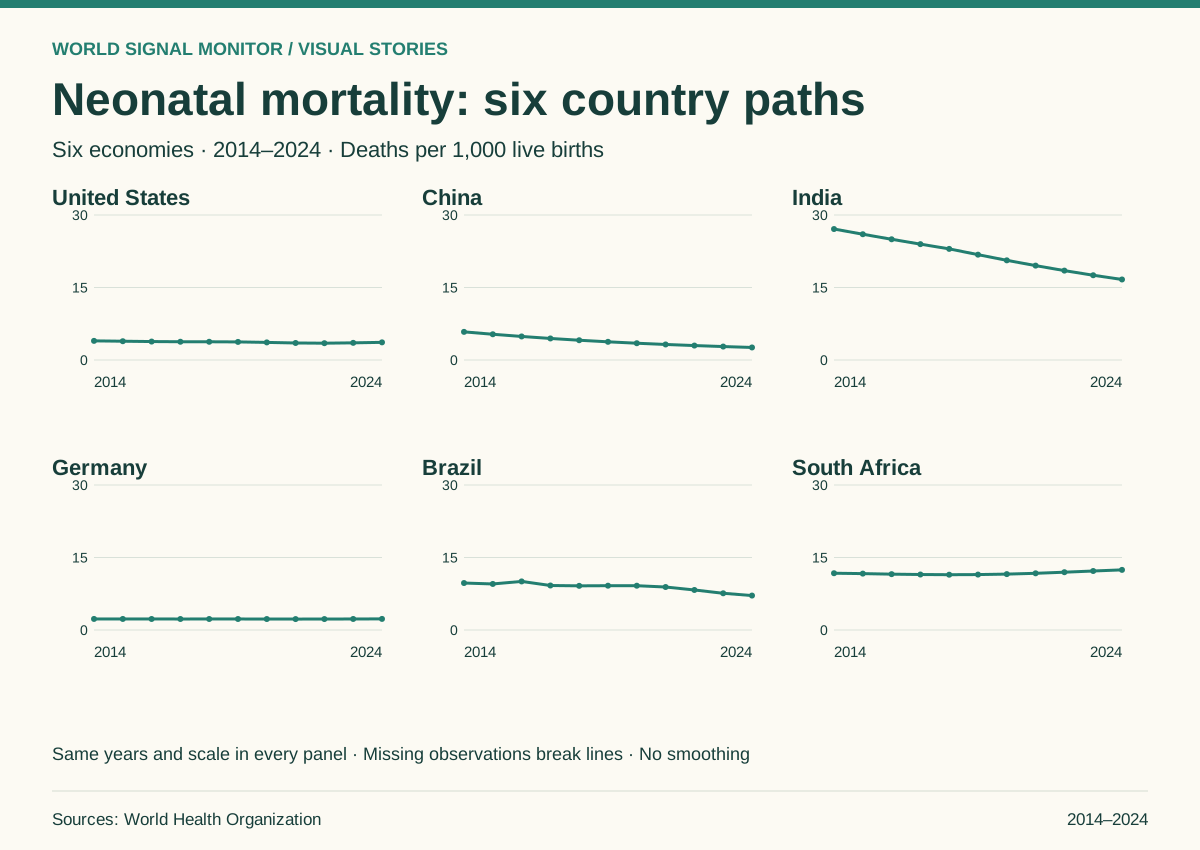
Neonatal mortality: six country paths
Compare country levels and changes using the same years and one shared vertical scale across all six panels.
Explore the story →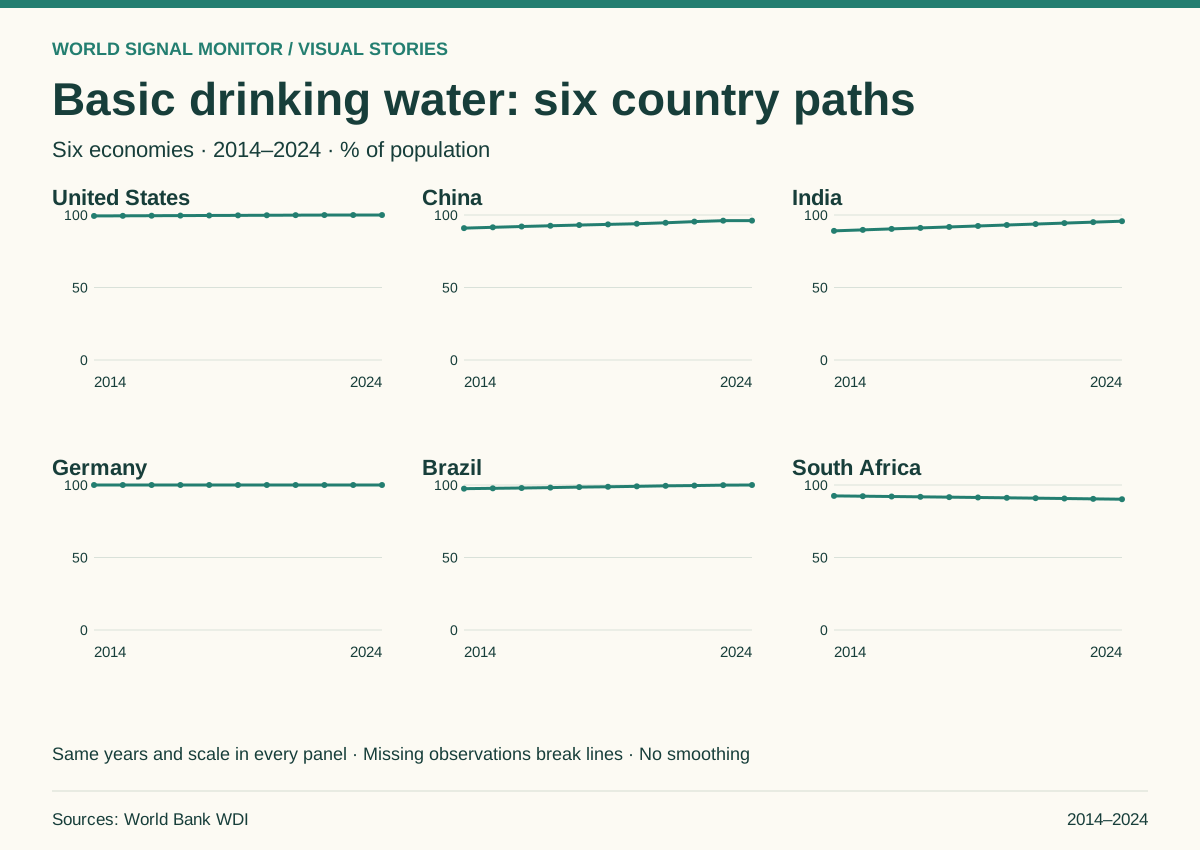
Basic drinking water: six country paths
Compare country levels and changes using the same years and one shared vertical scale across all six panels.
Explore the story →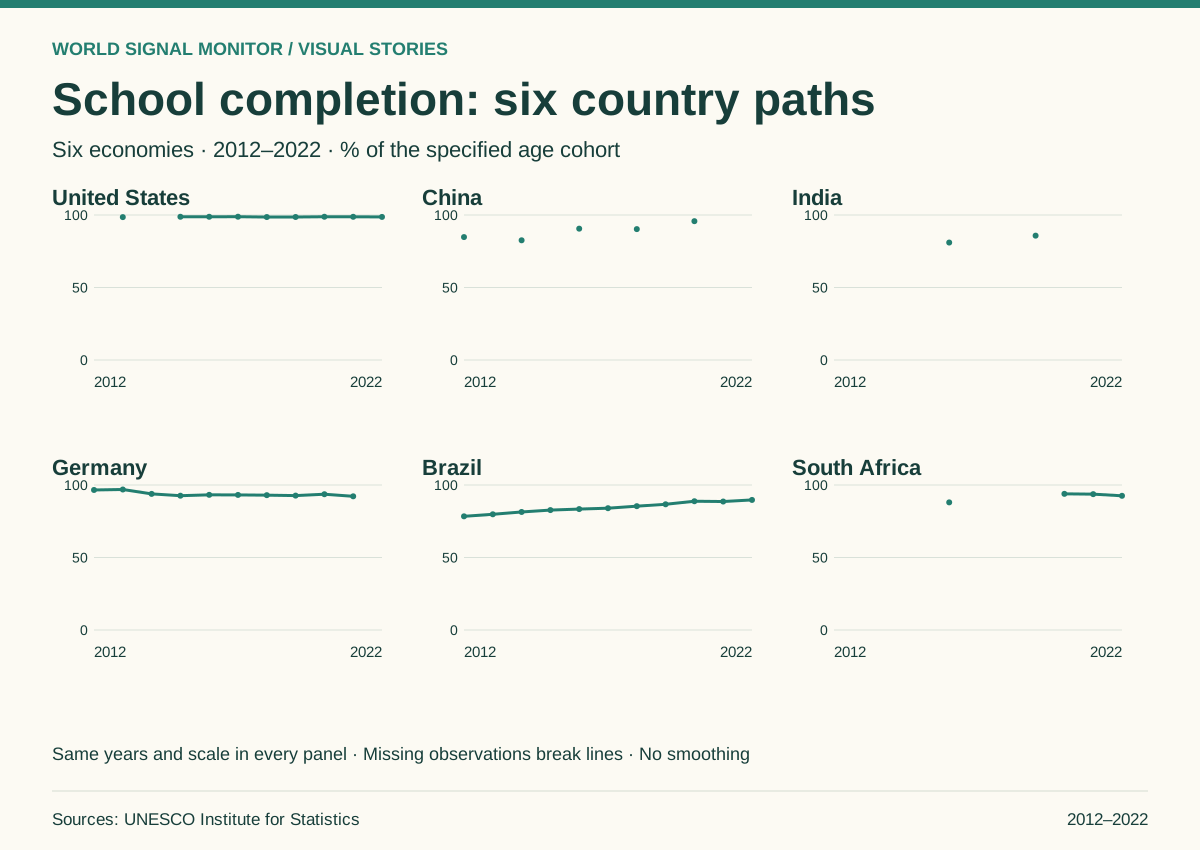
School completion: six country paths
Compare country levels and changes using the same years and one shared vertical scale across all six panels.
Explore the story →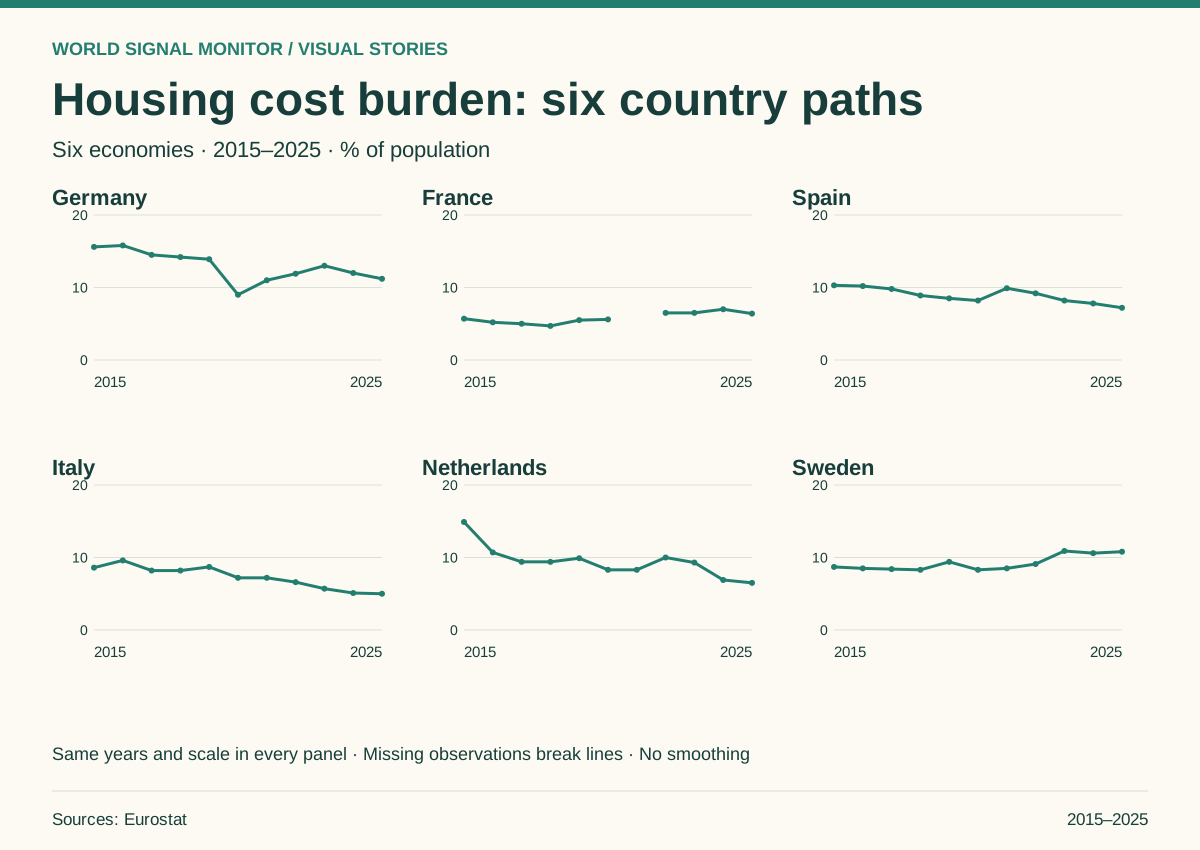
Housing cost burden: six country paths
Compare country levels and changes using the same years and one shared vertical scale across all six panels.
Explore the story →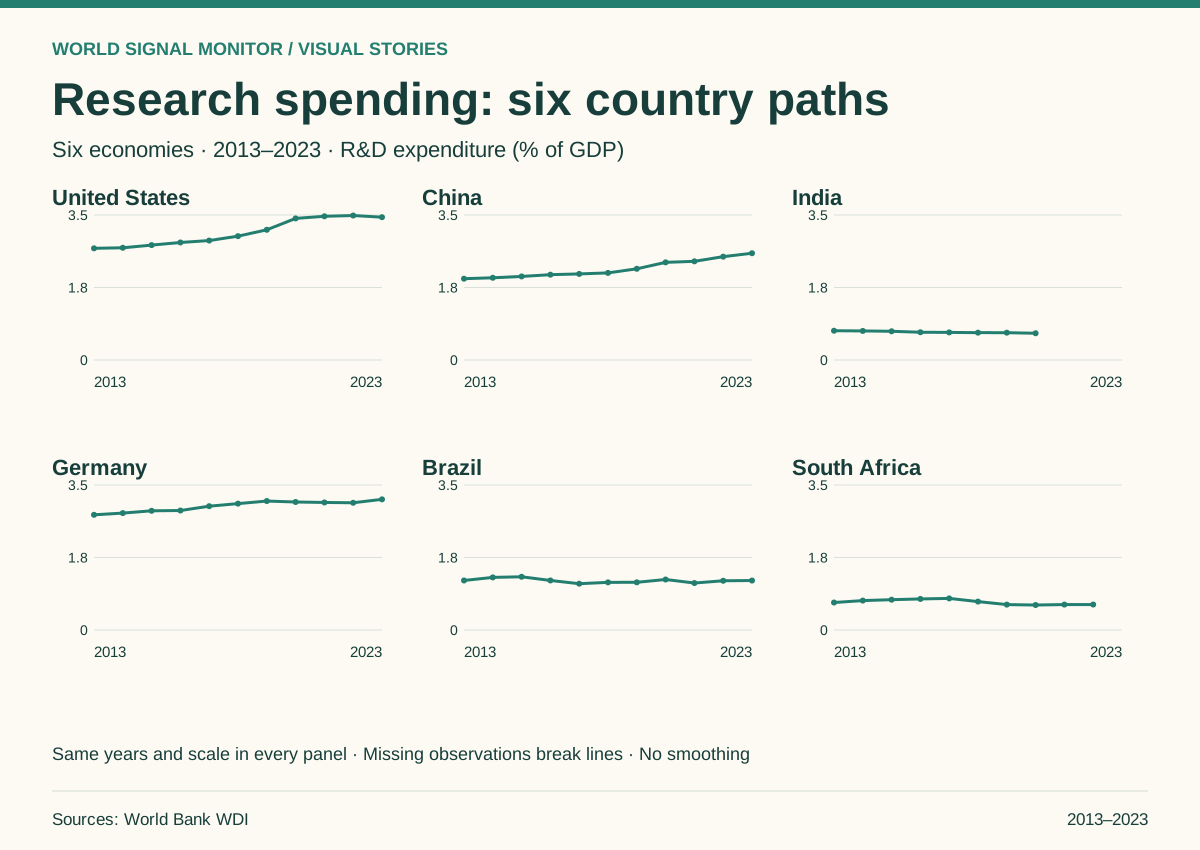
Research spending: six country paths
Compare country levels and changes using the same years and one shared vertical scale across all six panels.
Explore the story →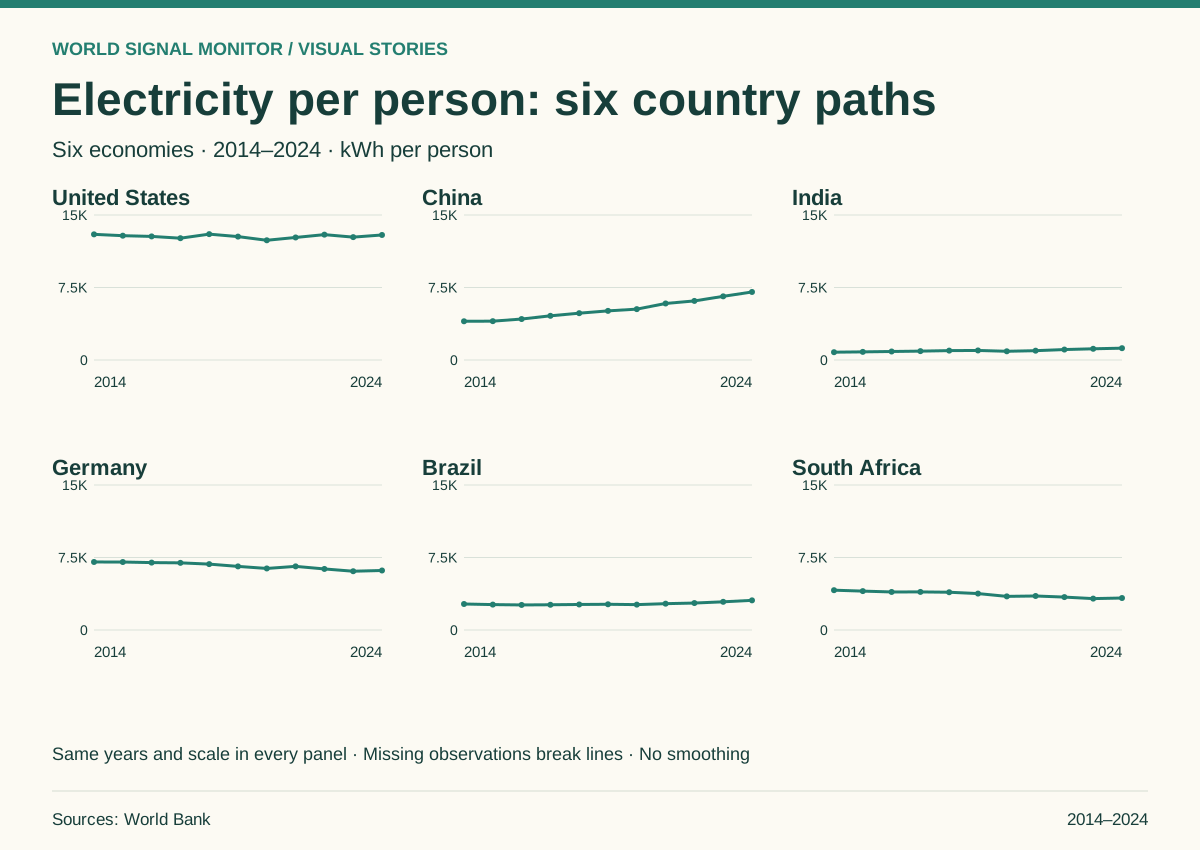
Electricity per person: six country paths
Compare country levels and changes using the same years and one shared vertical scale across all six panels.
Explore the story →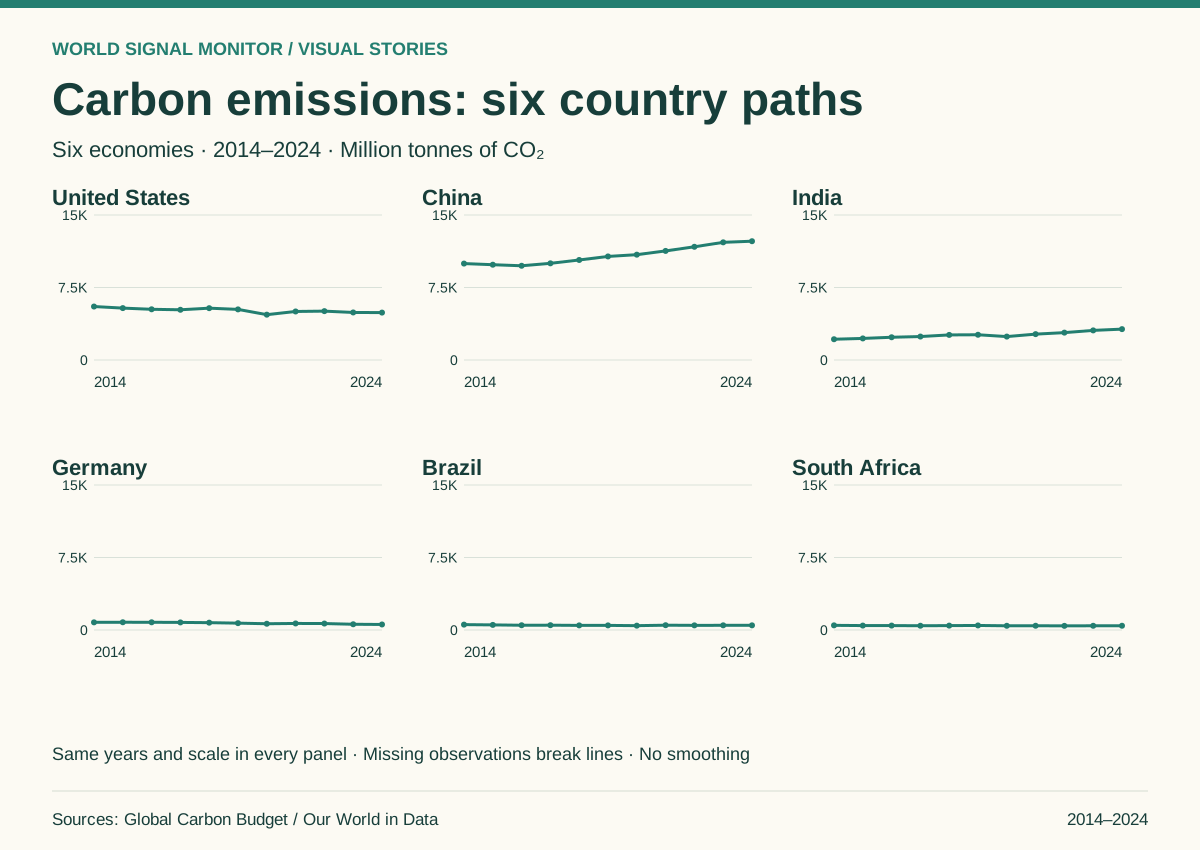
Carbon emissions: six country paths
Compare country levels and changes using the same years and one shared vertical scale across all six panels.
Explore the story →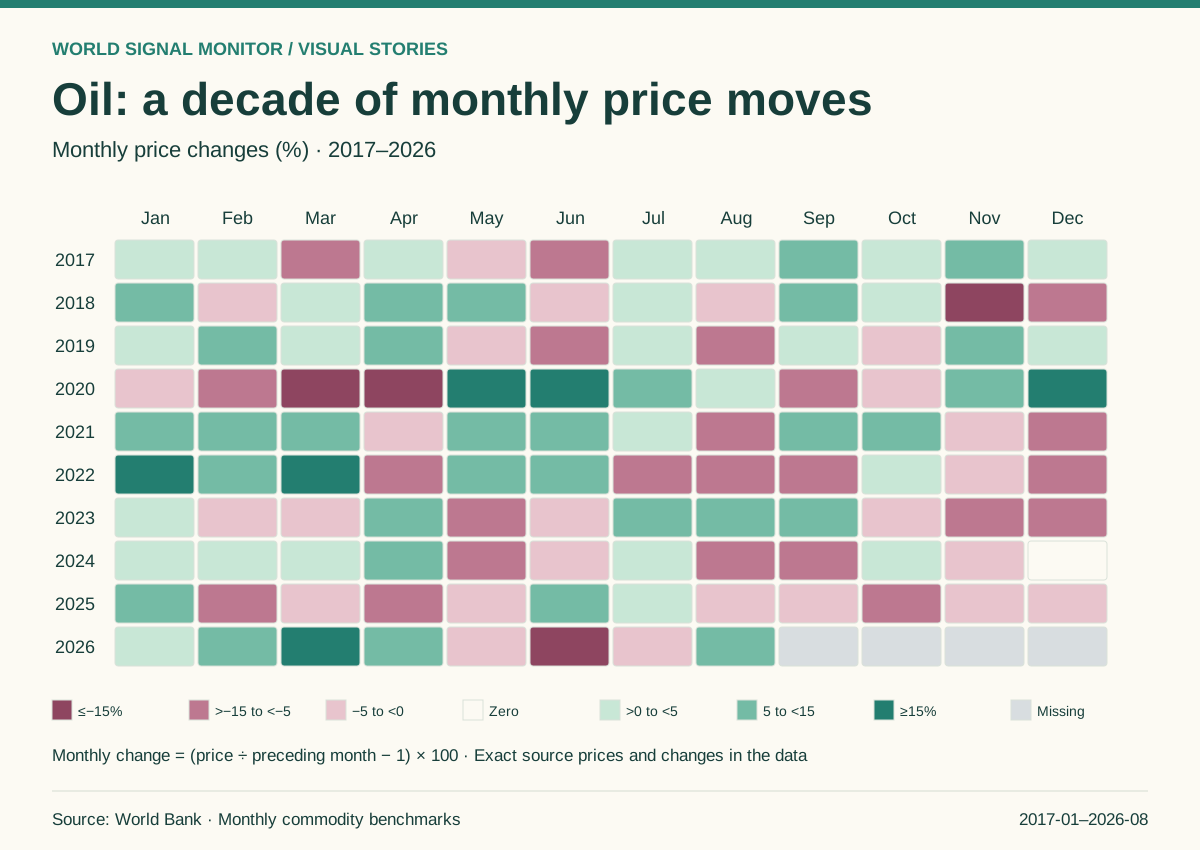
Oil: a decade of monthly price moves
Read each year across the months to find price increases, declines and quiet periods. Retained source prices extend through 2026-08; unavailable months stay grey.
Explore the story →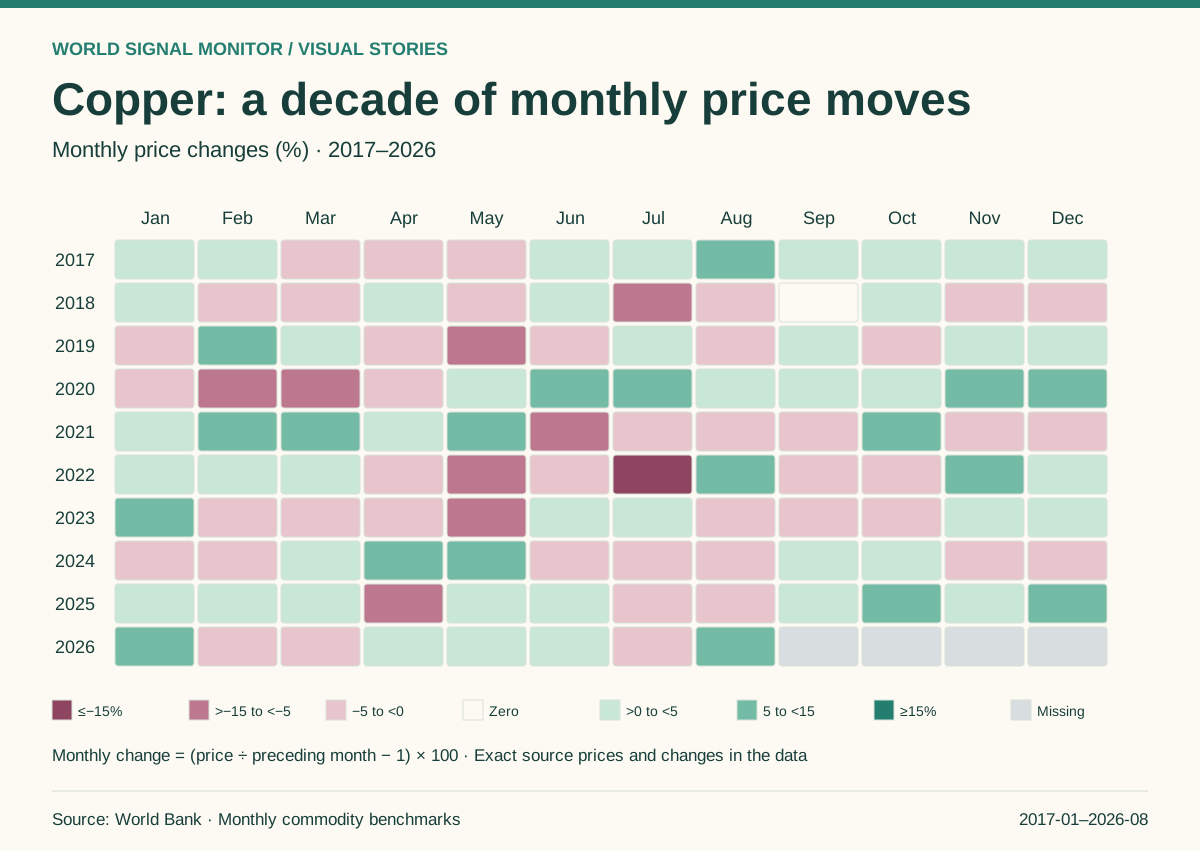
Copper: a decade of monthly price moves
Read each year across the months to find price increases, declines and quiet periods. Retained source prices extend through 2026-08; unavailable months stay grey.
Explore the story →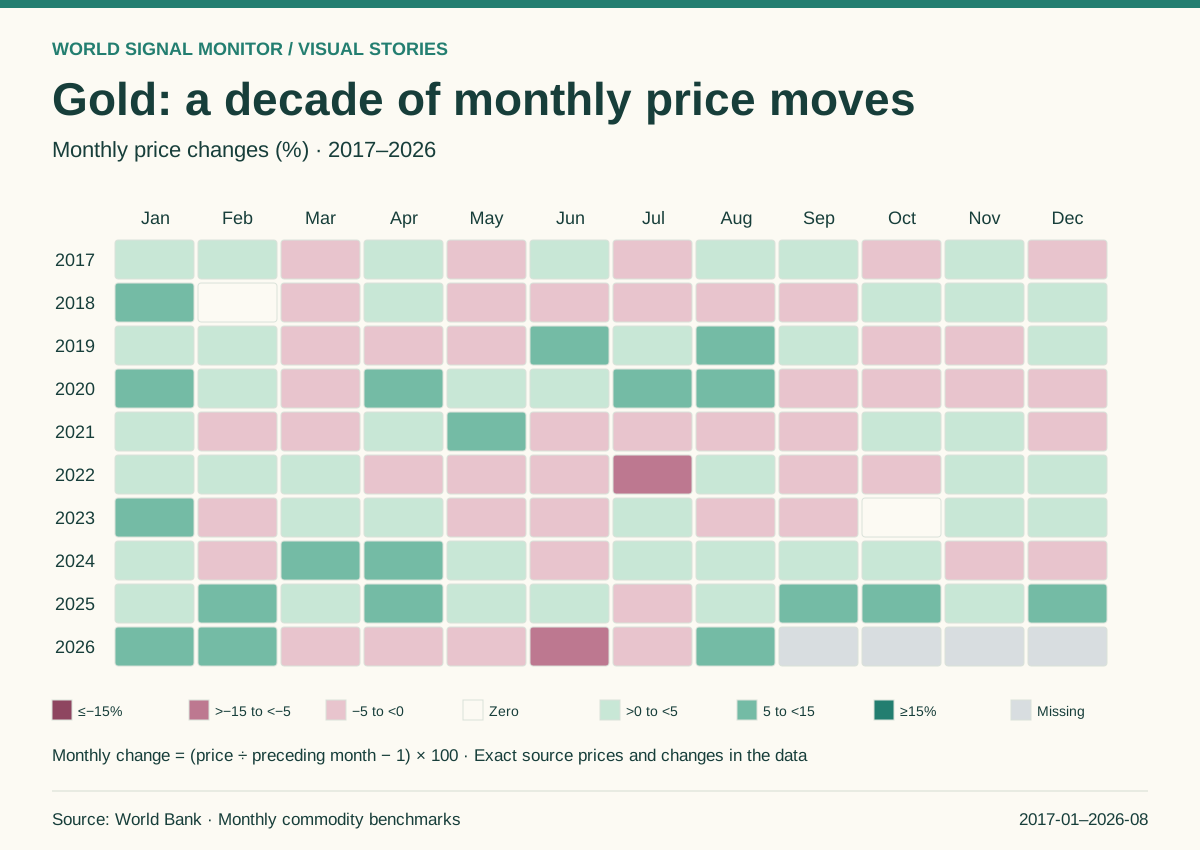
Gold: a decade of monthly price moves
Read each year across the months to find price increases, declines and quiet periods. Retained source prices extend through 2026-08; unavailable months stay grey.
Explore the story →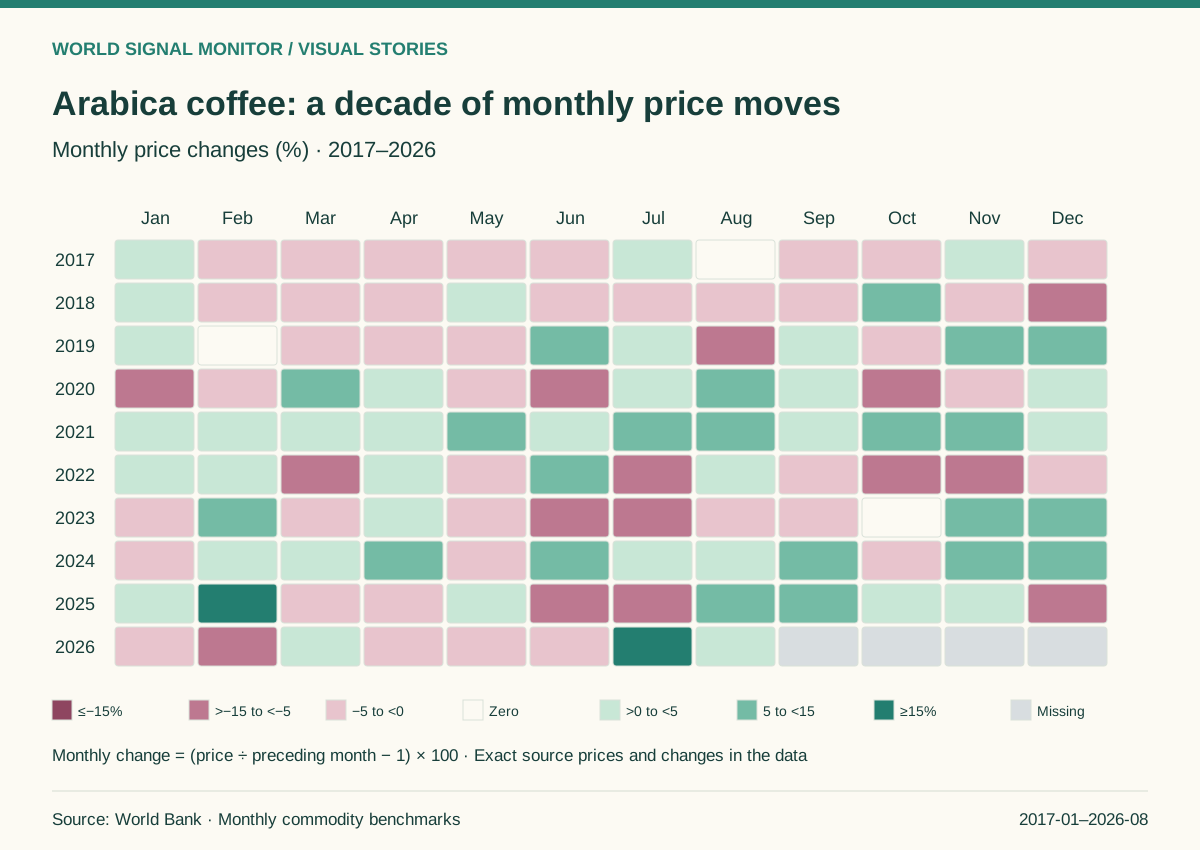
Arabica coffee: a decade of monthly price moves
Read each year across the months to find price increases, declines and quiet periods. Retained source prices extend through 2026-08; unavailable months stay grey.
Explore the story →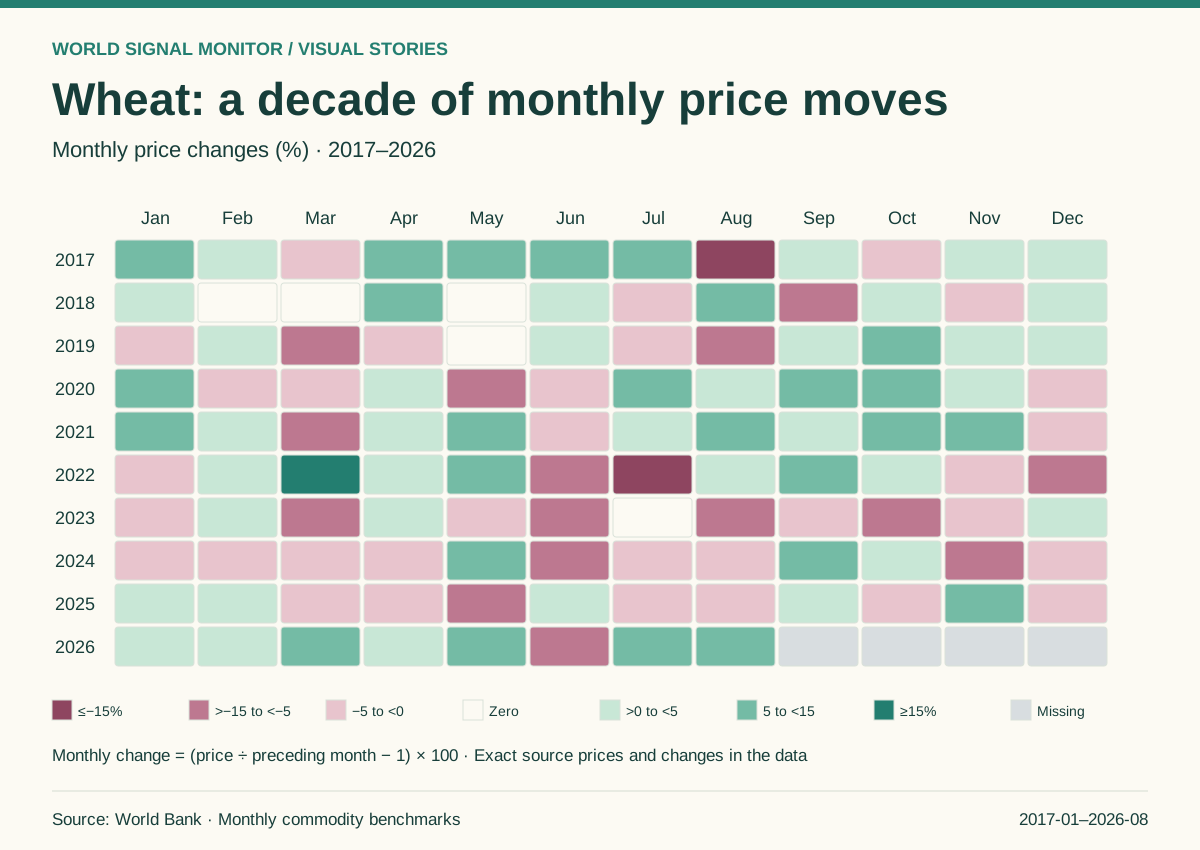
Wheat: a decade of monthly price moves
Read each year across the months to find price increases, declines and quiet periods. Retained source prices extend through 2026-08; unavailable months stay grey.
Explore the story →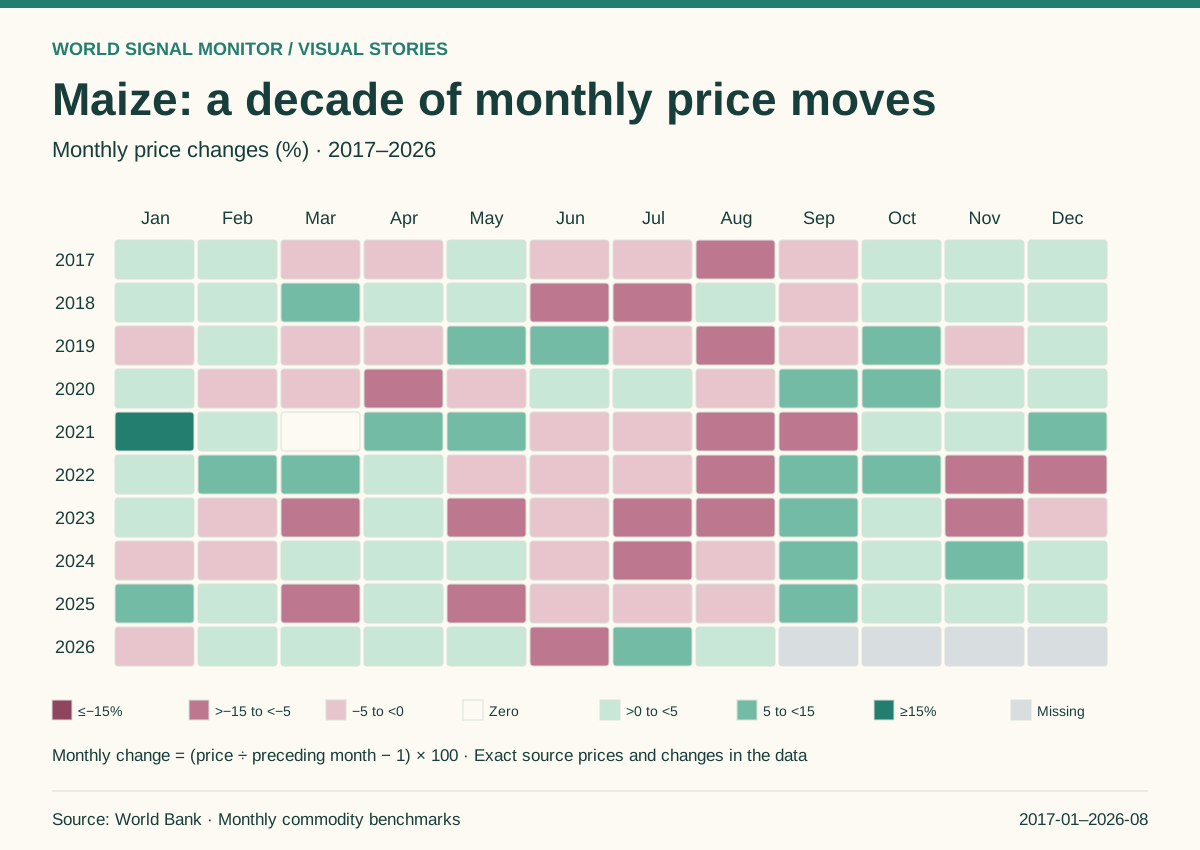
Maize: a decade of monthly price moves
Read each year across the months to find price increases, declines and quiet periods. Retained source prices extend through 2026-08; unavailable months stay grey.
Explore the story →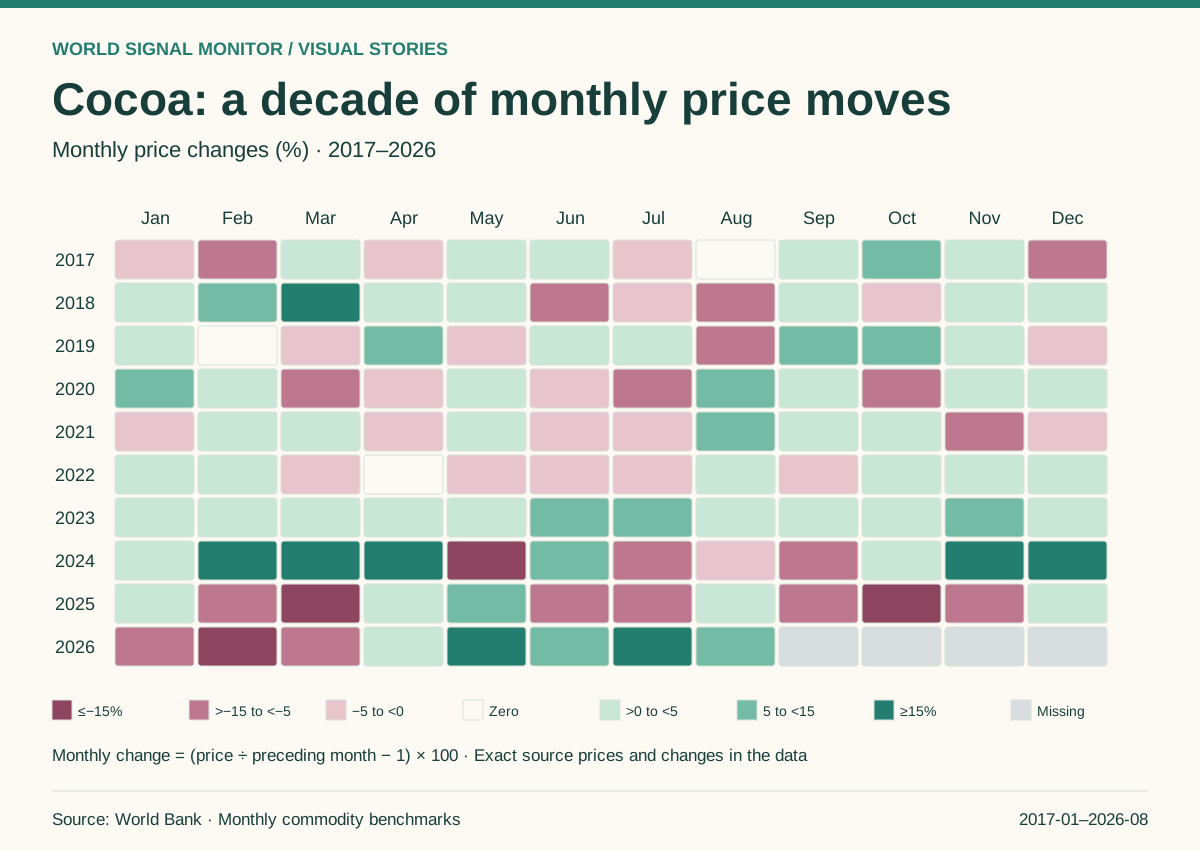
Cocoa: a decade of monthly price moves
Read each year across the months to find price increases, declines and quiet periods. Retained source prices extend through 2026-08; unavailable months stay grey.
Explore the story →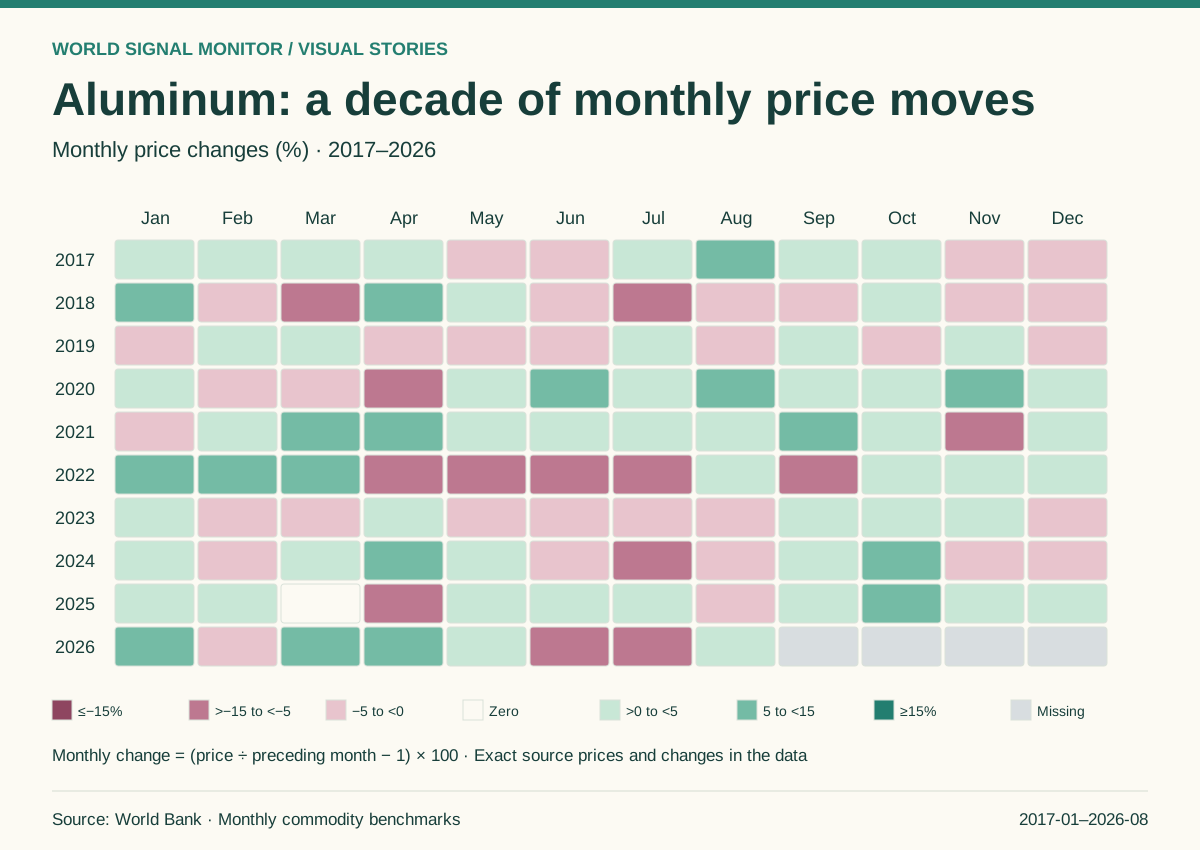
Aluminum: a decade of monthly price moves
Read each year across the months to find price increases, declines and quiet periods. Retained source prices extend through 2026-08; unavailable months stay grey.
Explore the story →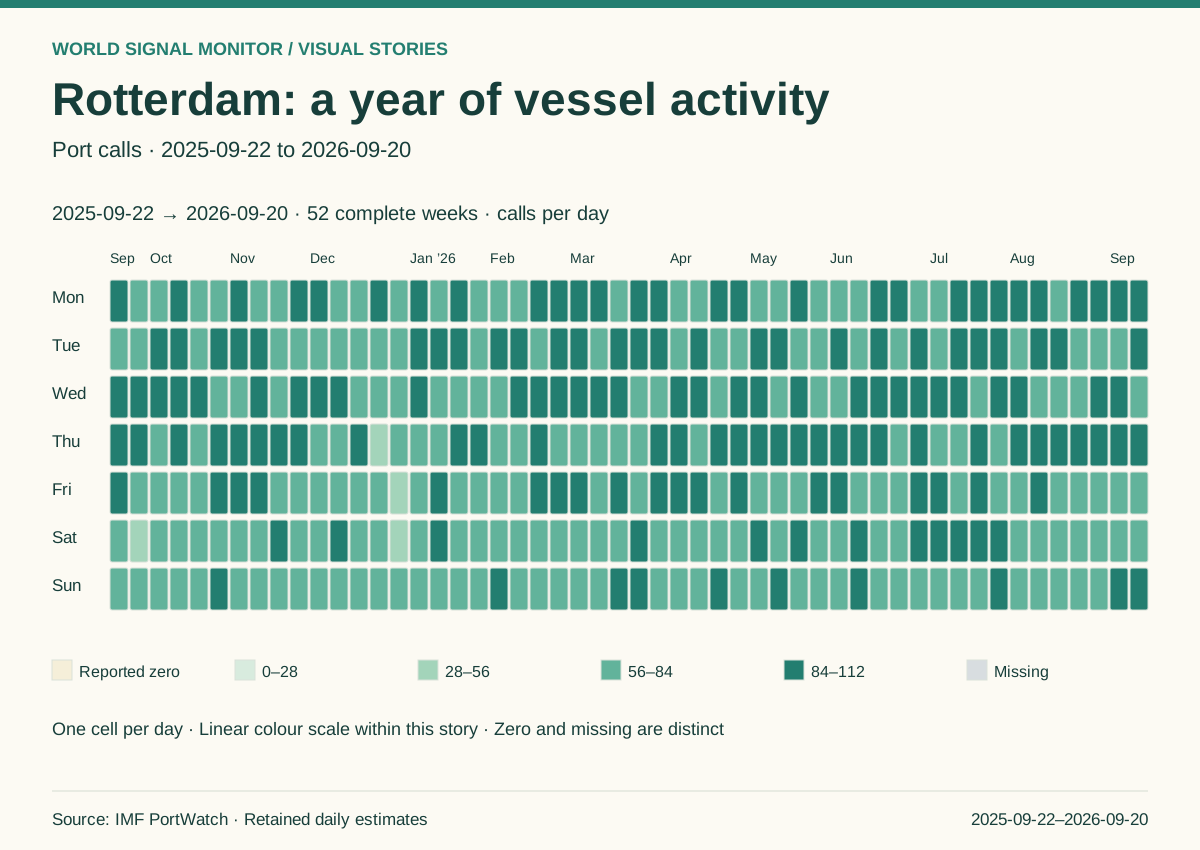
Rotterdam: a year of vessel activity
A daily view of vessel activity, with reported zero and missing observations shown separately.
Explore the story →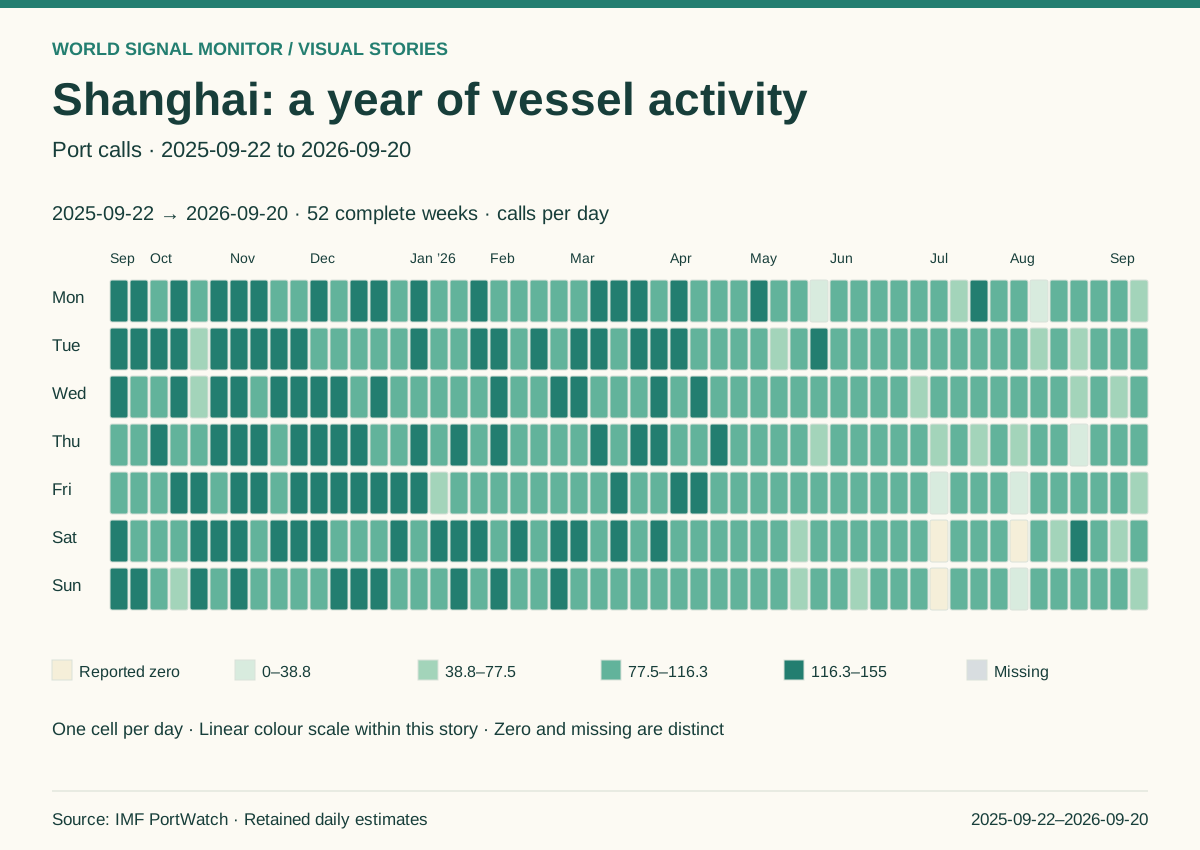
Shanghai: a year of vessel activity
A daily view of vessel activity, with reported zero and missing observations shown separately.
Explore the story →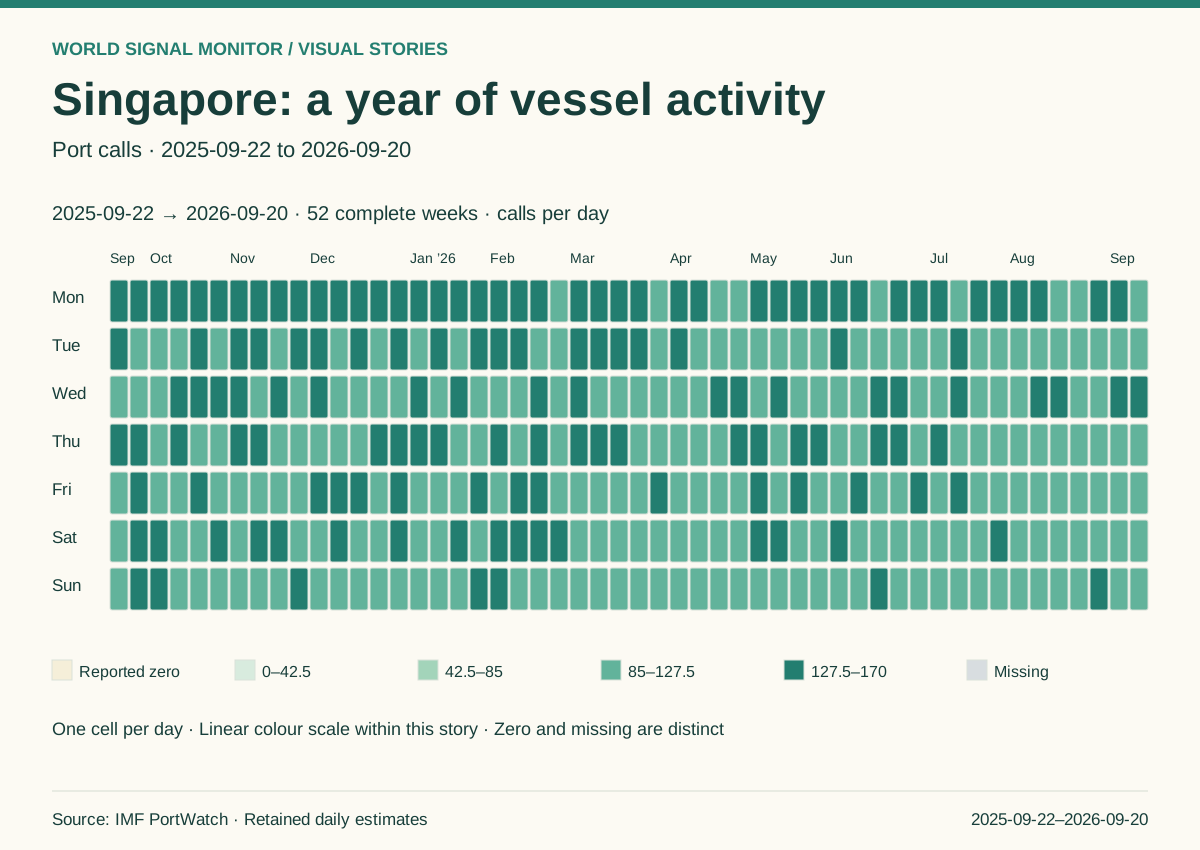
Singapore: a year of vessel activity
A daily view of vessel activity, with reported zero and missing observations shown separately.
Explore the story →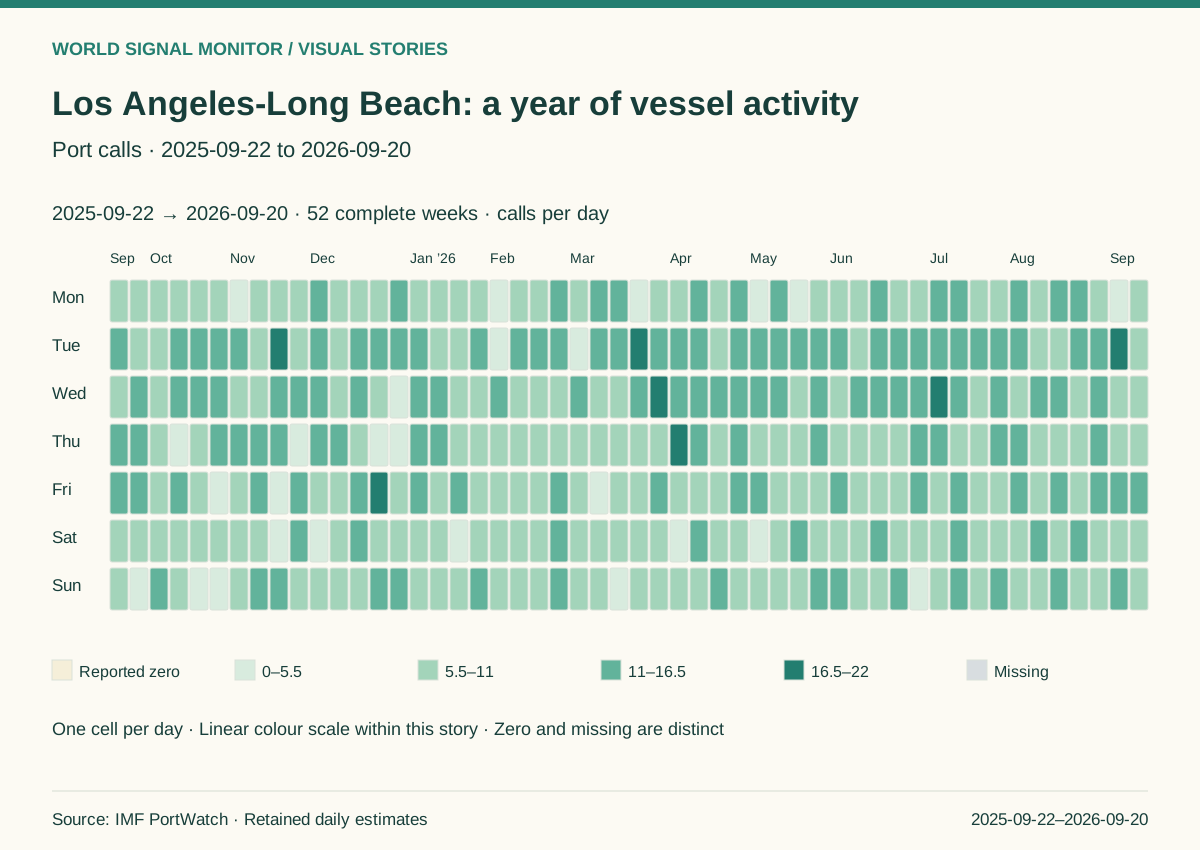
Los Angeles-Long Beach: a year of vessel activity
A daily view of vessel activity, with reported zero and missing observations shown separately.
Explore the story →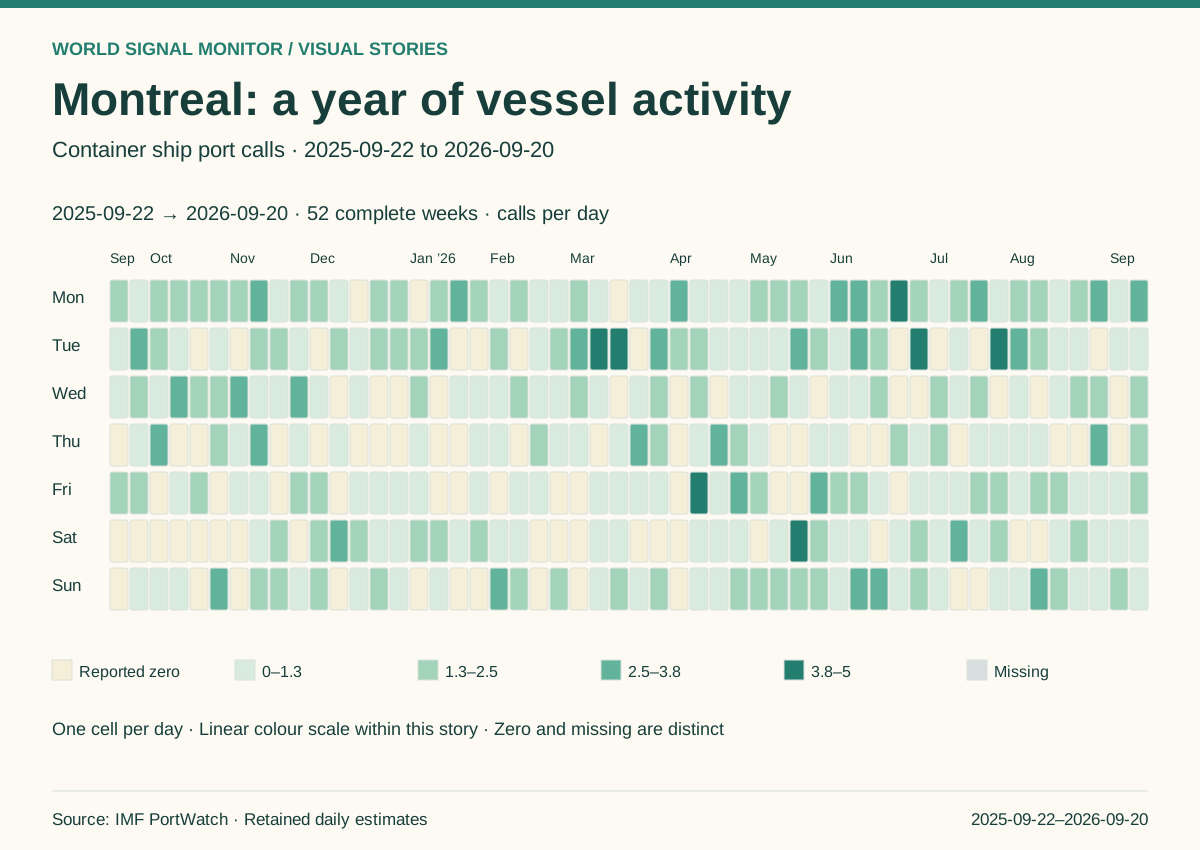
Montreal: a year of vessel activity
A daily view of vessel activity, with reported zero and missing observations shown separately.
Explore the story →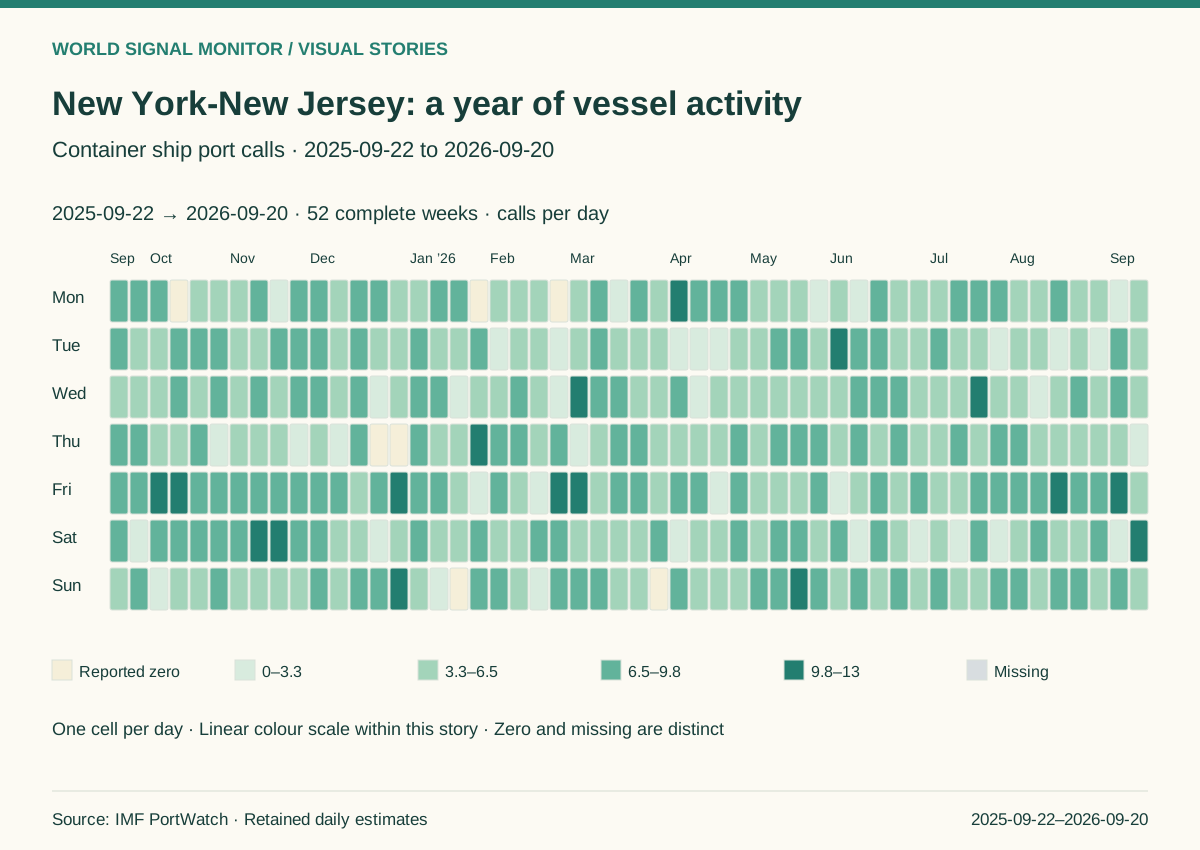
New York-New Jersey: a year of vessel activity
A daily view of vessel activity, with reported zero and missing observations shown separately.
Explore the story →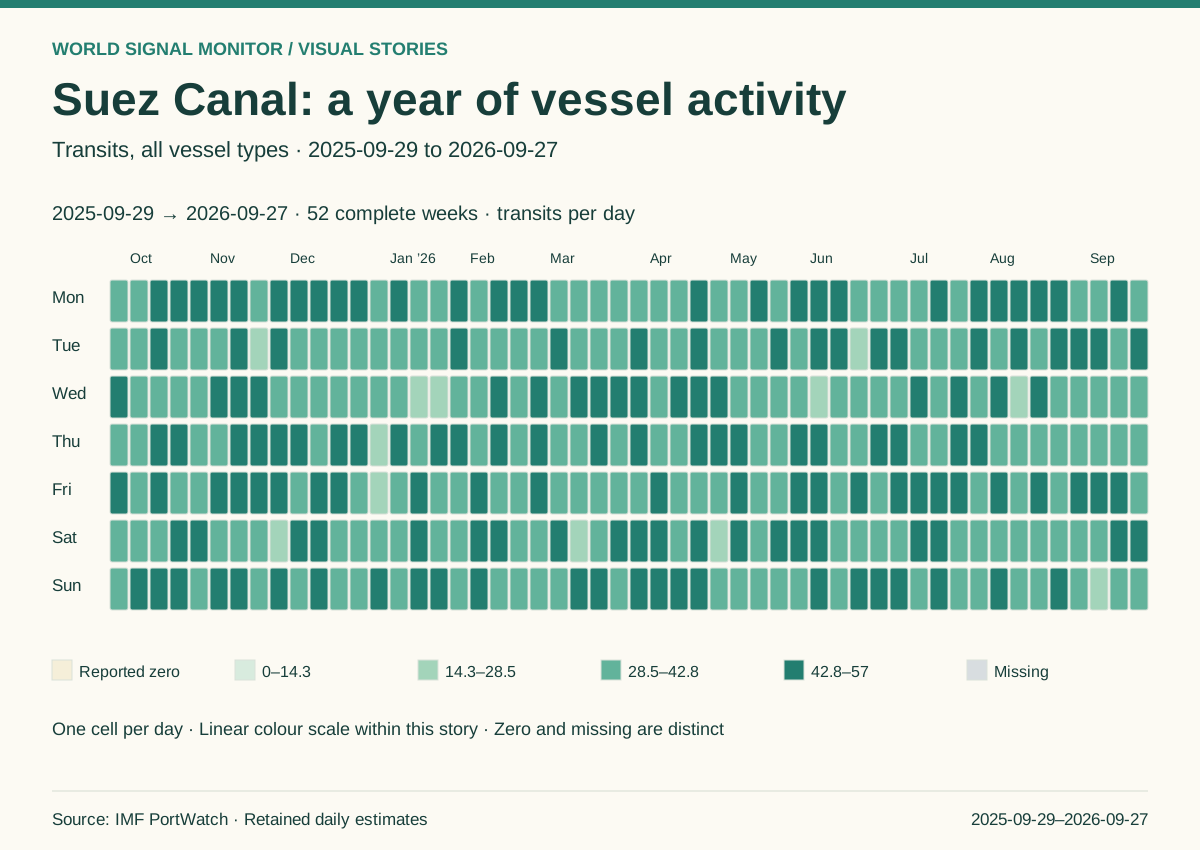
Suez Canal: a year of vessel activity
A daily view of vessel activity, with reported zero and missing observations shown separately.
Explore the story →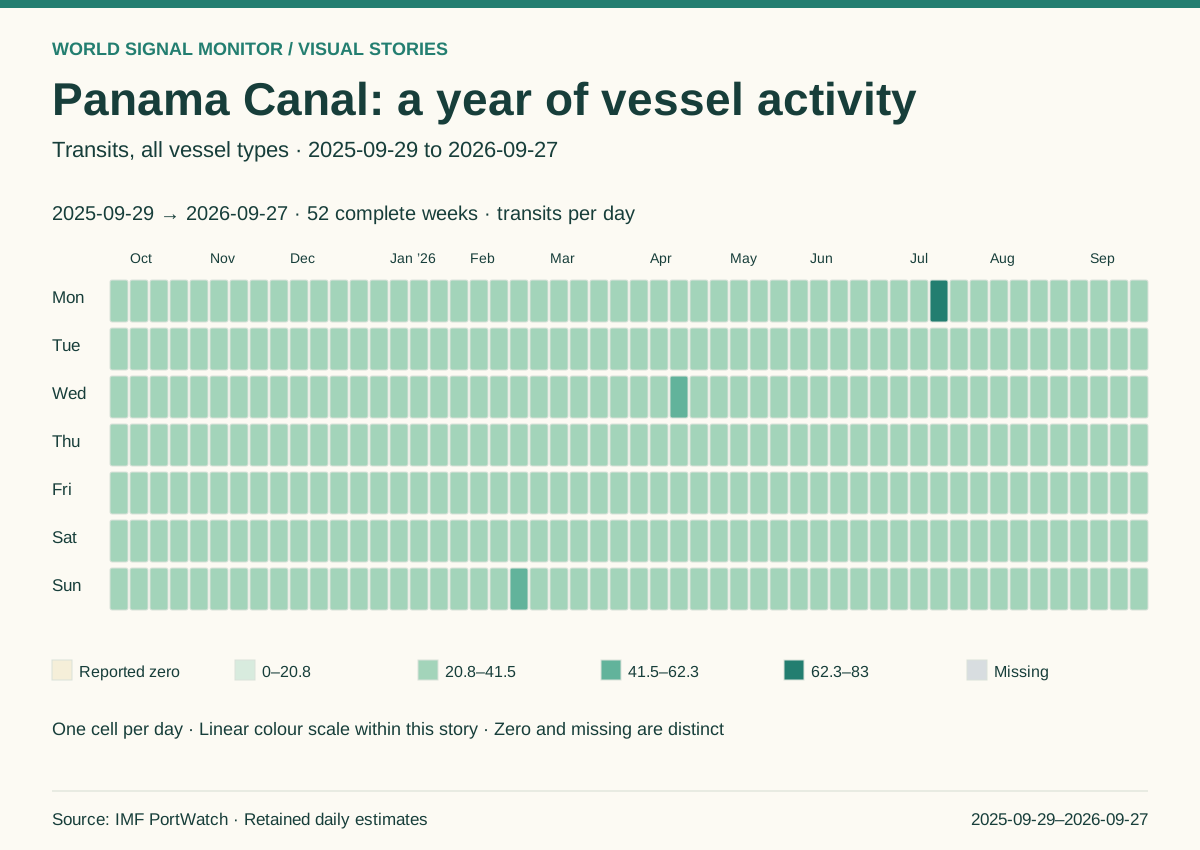
Panama Canal: a year of vessel activity
A daily view of vessel activity, with reported zero and missing observations shown separately.
Explore the story →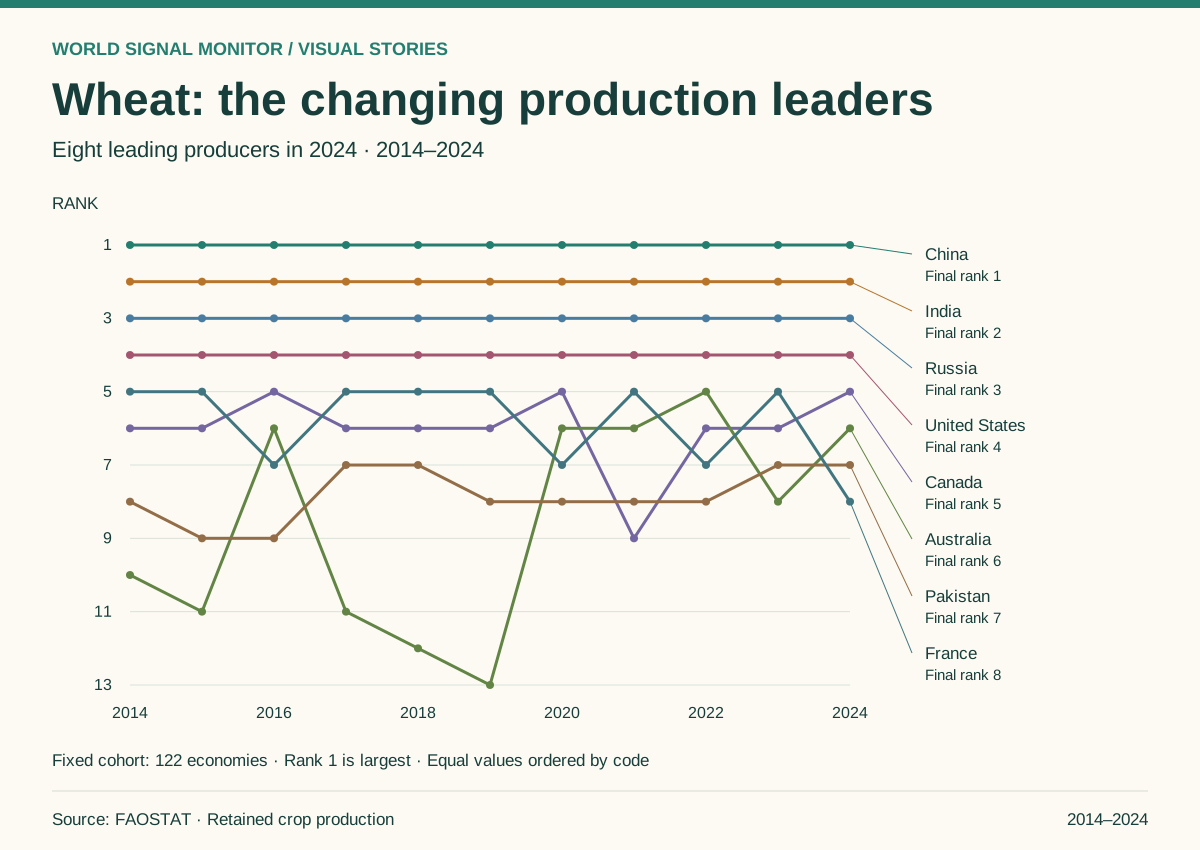
Wheat: the changing production leaders
Follow the eight largest final-year producers within 122 economies with observations in every displayed year.
Explore the story →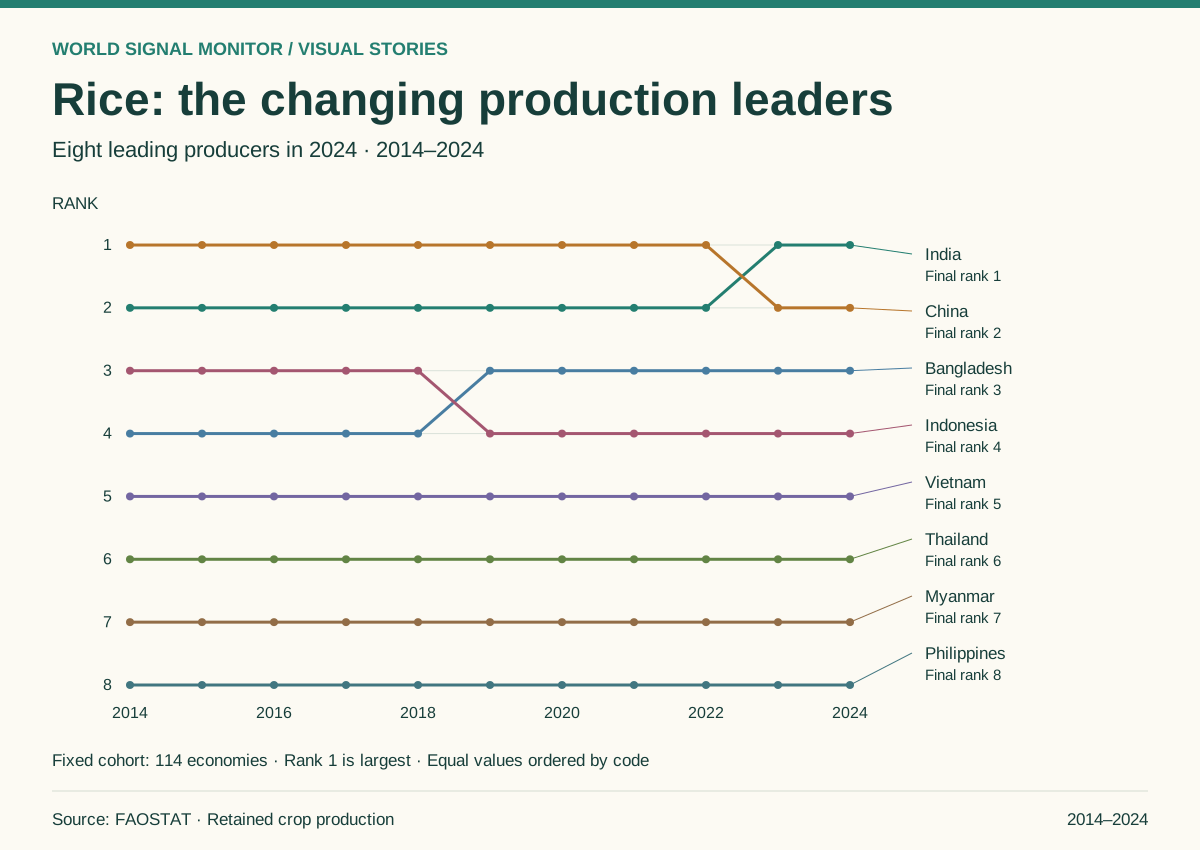
Rice: the changing production leaders
Follow the eight largest final-year producers within 114 economies with observations in every displayed year.
Explore the story →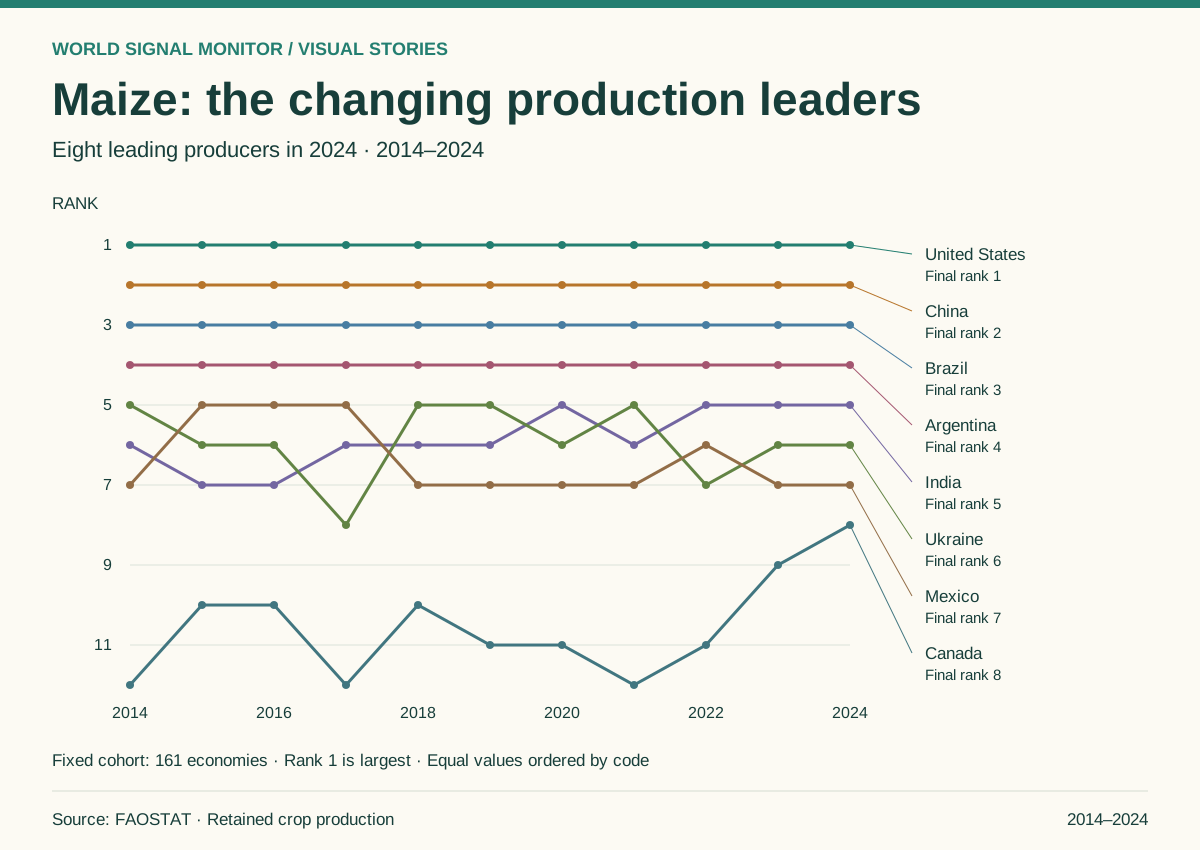
Maize: the changing production leaders
Follow the eight largest final-year producers within 161 economies with observations in every displayed year.
Explore the story →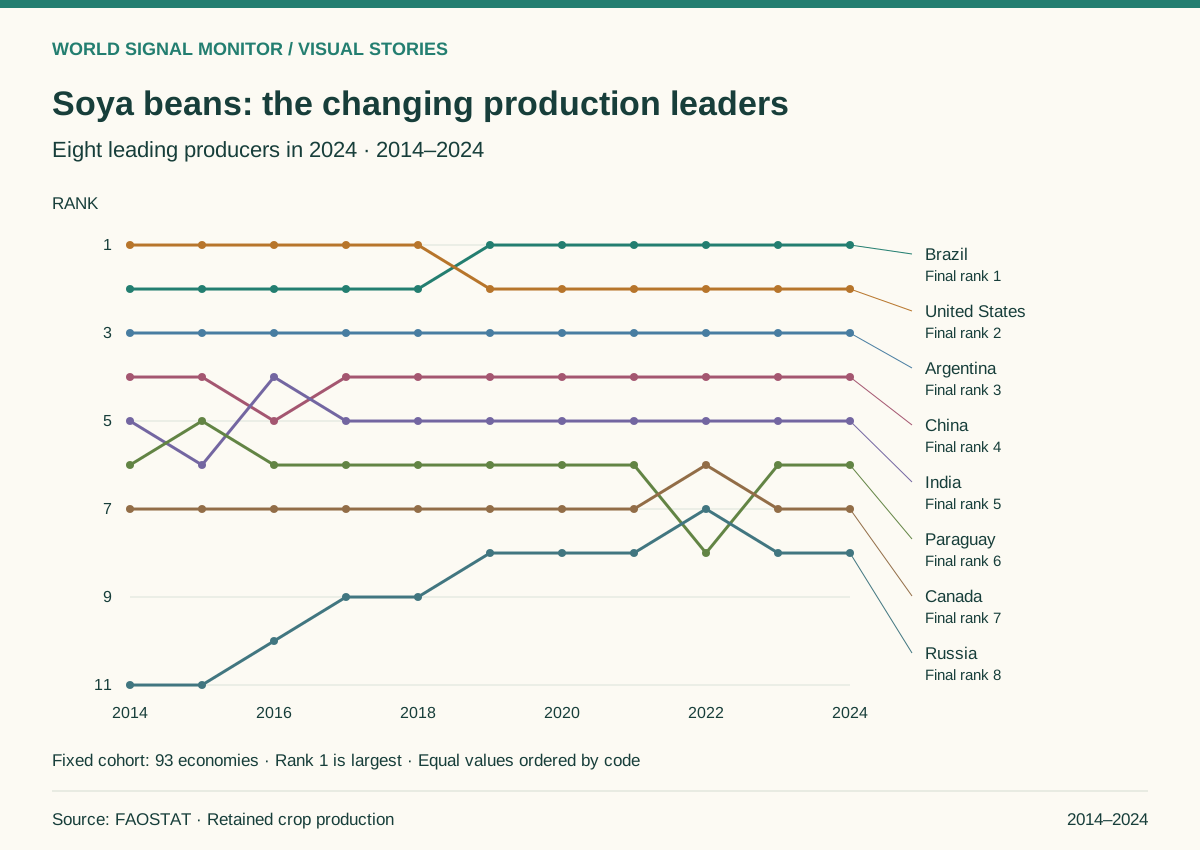
Soya beans: the changing production leaders
Follow the eight largest final-year producers within 93 economies with observations in every displayed year.
Explore the story →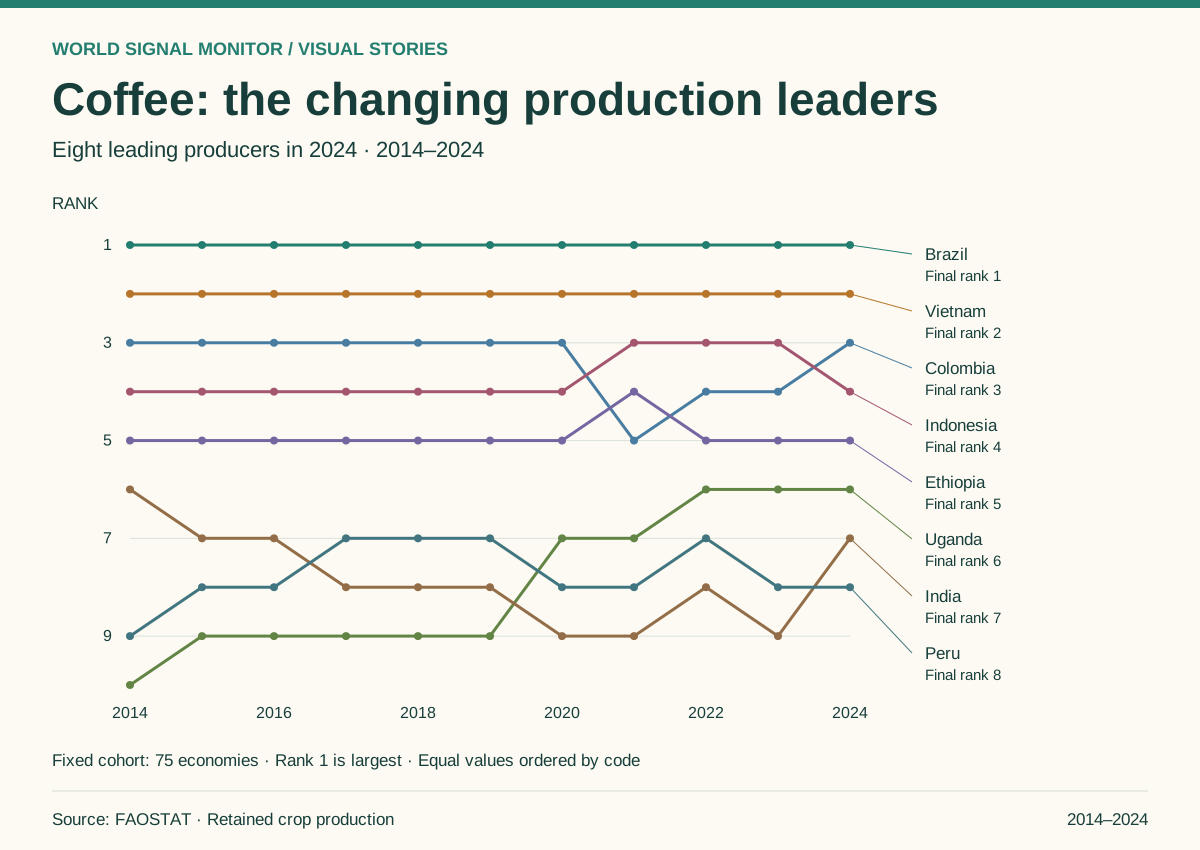
Coffee: the changing production leaders
Follow the eight largest final-year producers within 75 economies with observations in every displayed year.
Explore the story →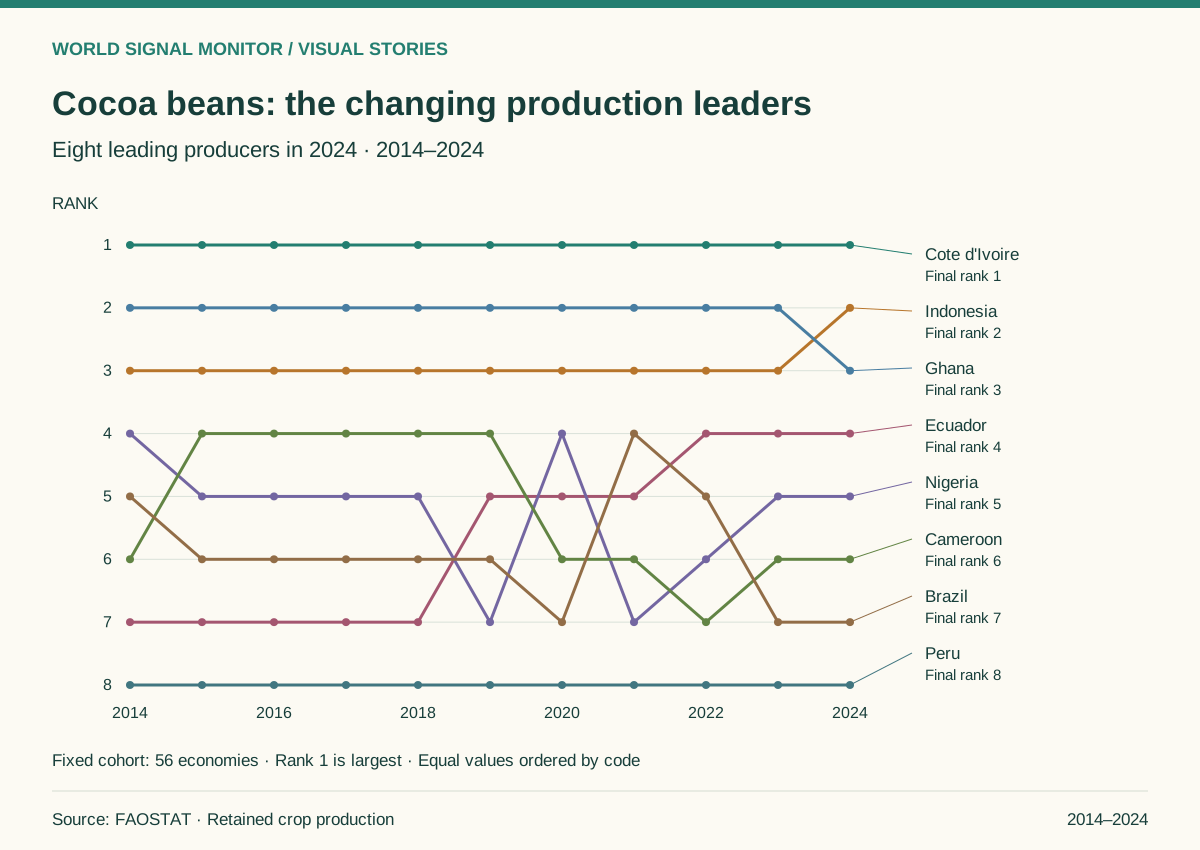
Cocoa beans: the changing production leaders
Follow the eight largest final-year producers within 56 economies with observations in every displayed year.
Explore the story →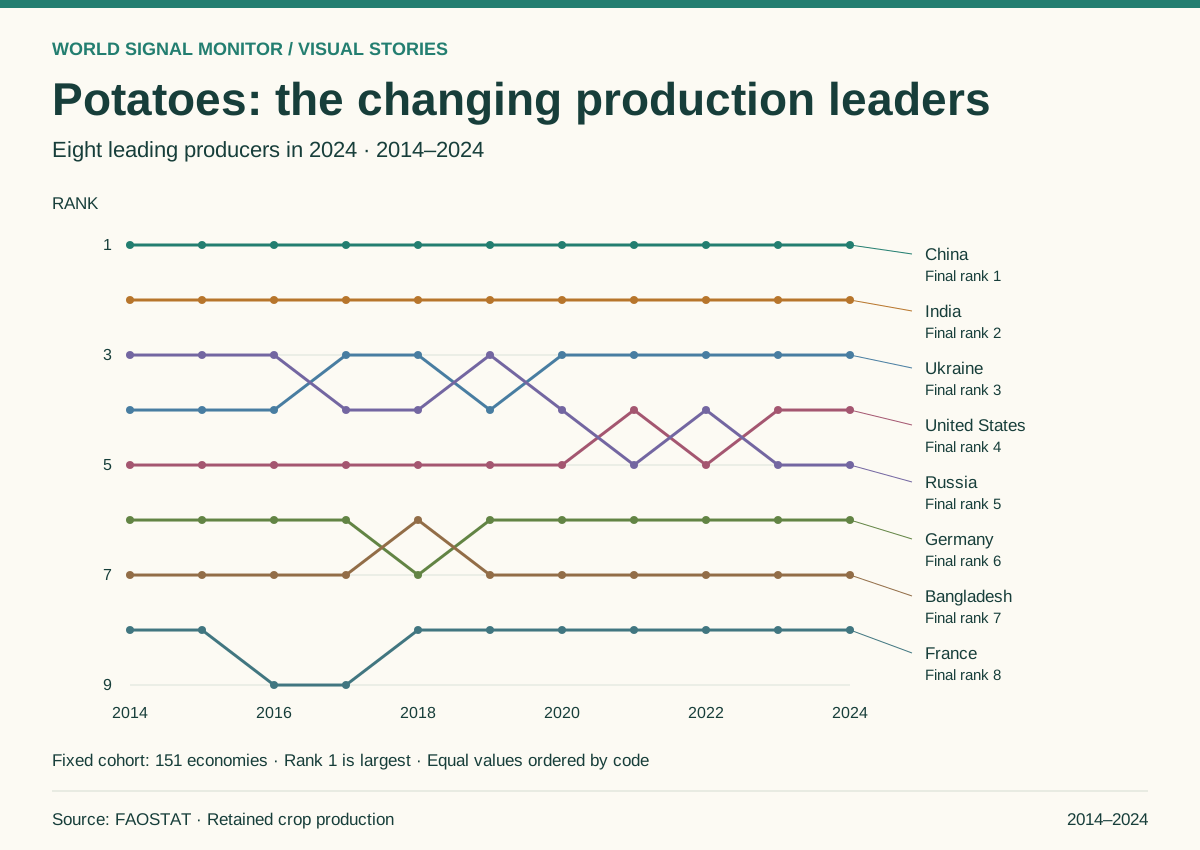
Potatoes: the changing production leaders
Follow the eight largest final-year producers within 151 economies with observations in every displayed year.
Explore the story →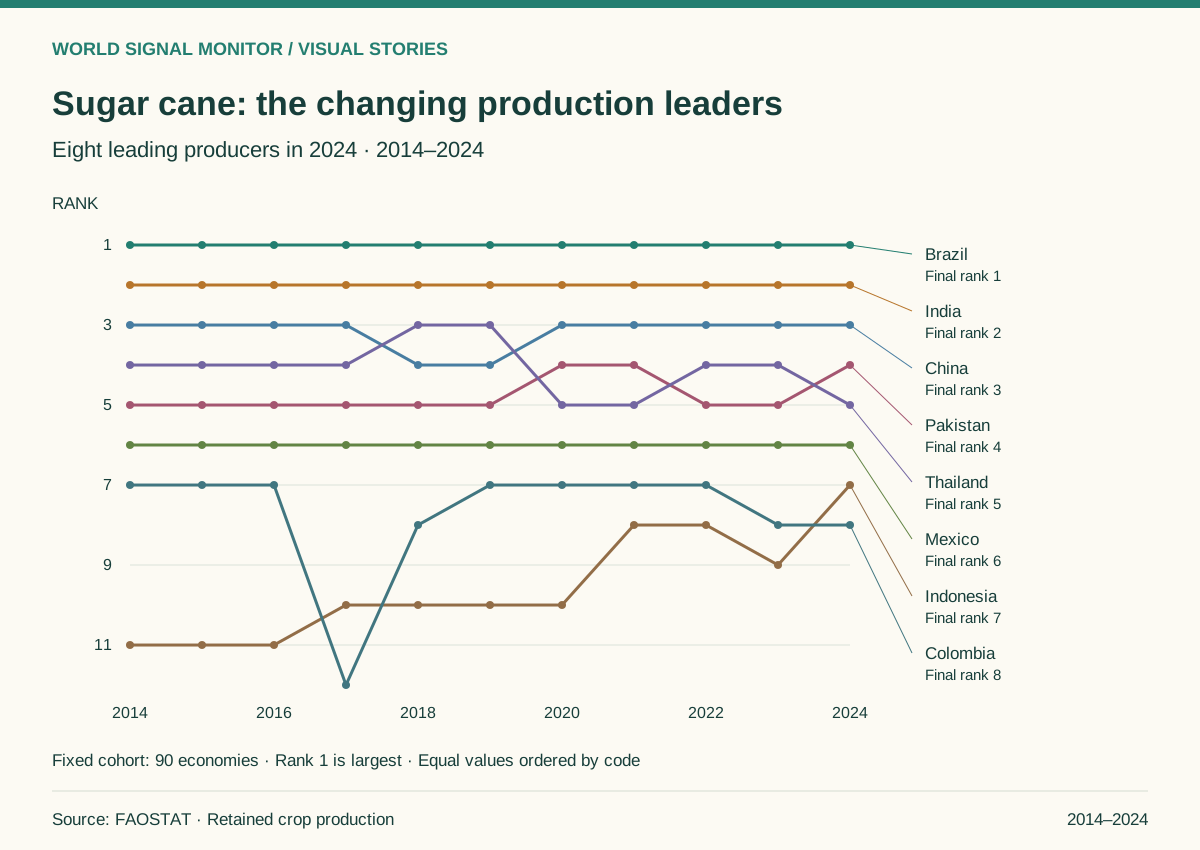
Sugar cane: the changing production leaders
Follow the eight largest final-year producers within 90 economies with observations in every displayed year.
Explore the story →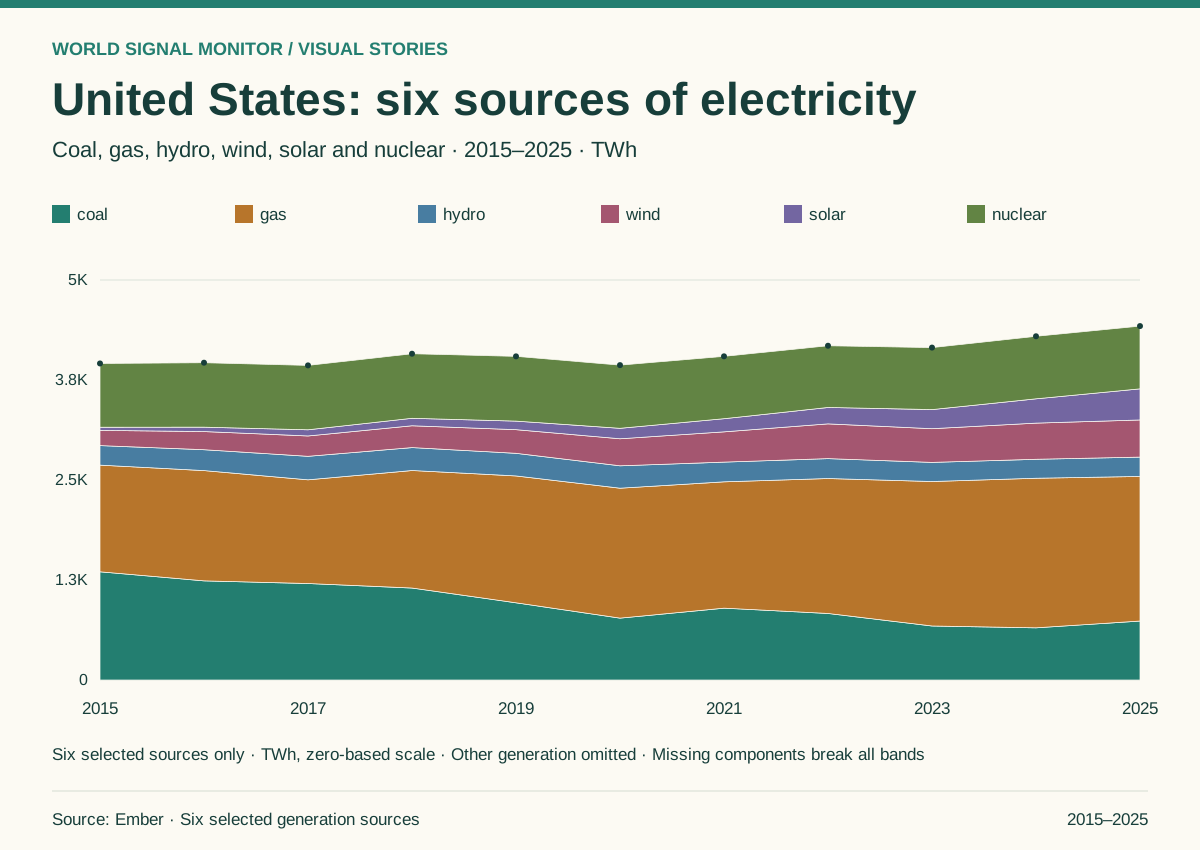
United States: six sources of electricity
Compare six non-overlapping generation categories through time using one zero-based TWh scale.
Explore the story →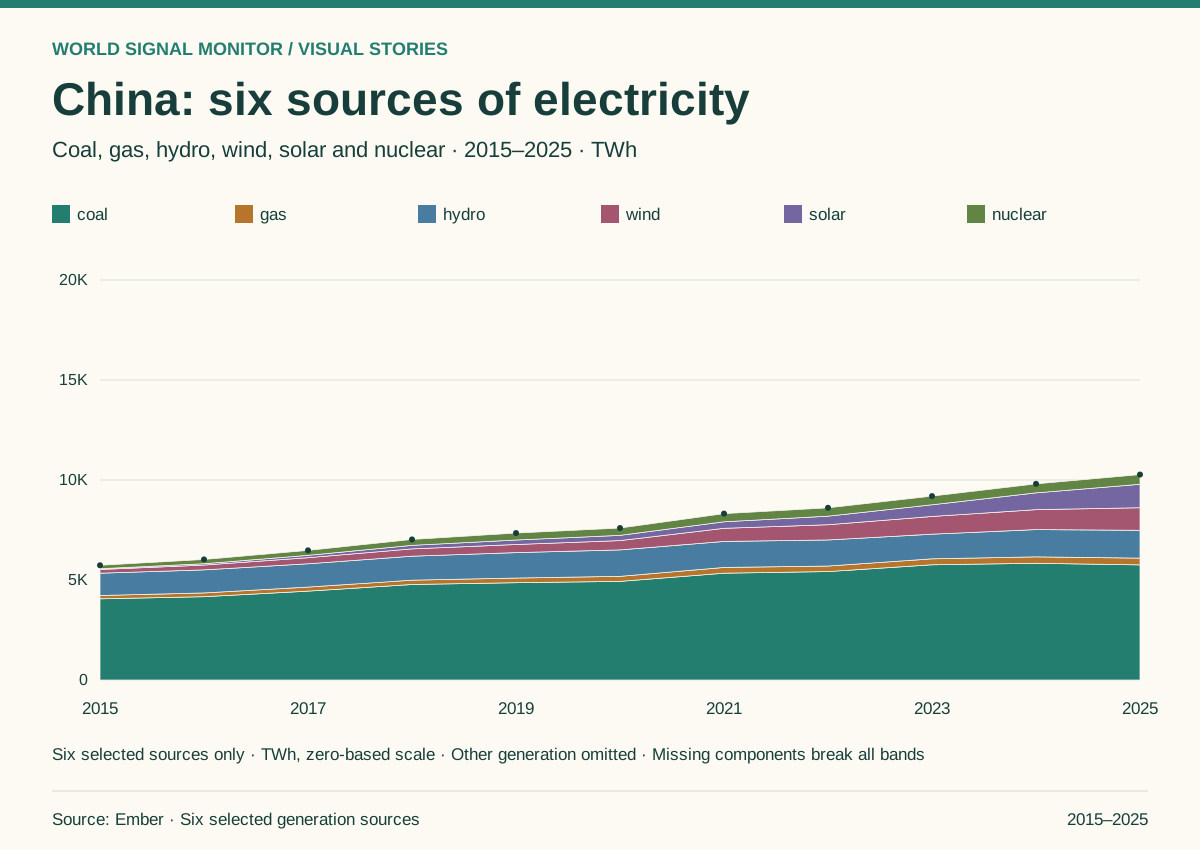
China: six sources of electricity
Compare six non-overlapping generation categories through time using one zero-based TWh scale.
Explore the story →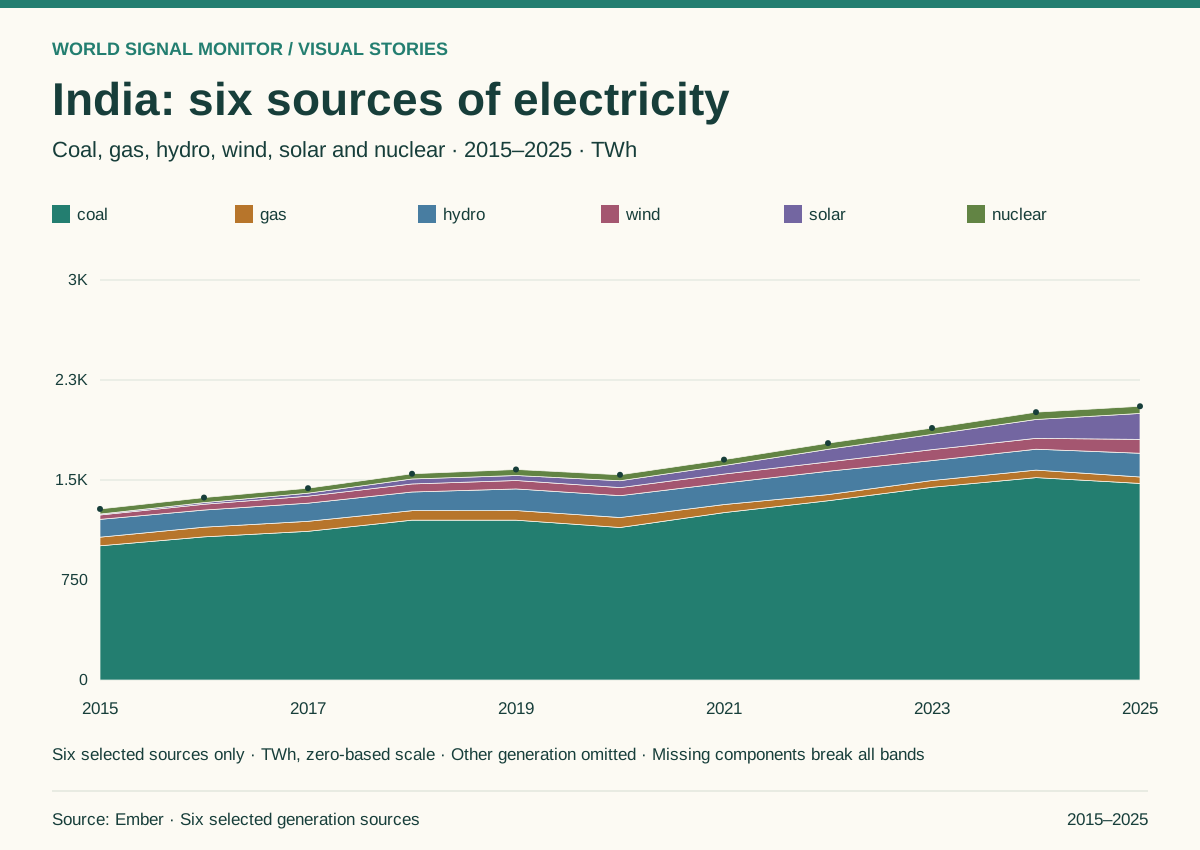
India: six sources of electricity
Compare six non-overlapping generation categories through time using one zero-based TWh scale.
Explore the story →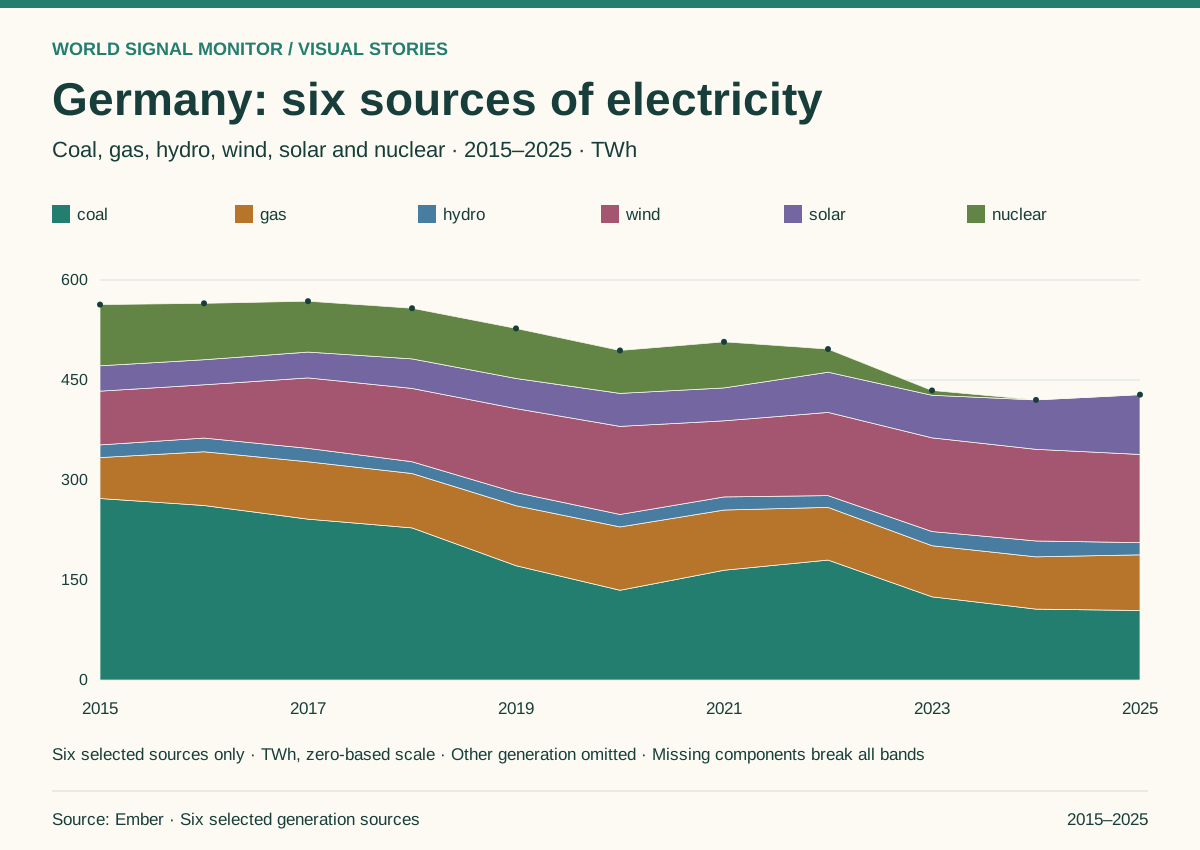
Germany: six sources of electricity
Compare six non-overlapping generation categories through time using one zero-based TWh scale.
Explore the story →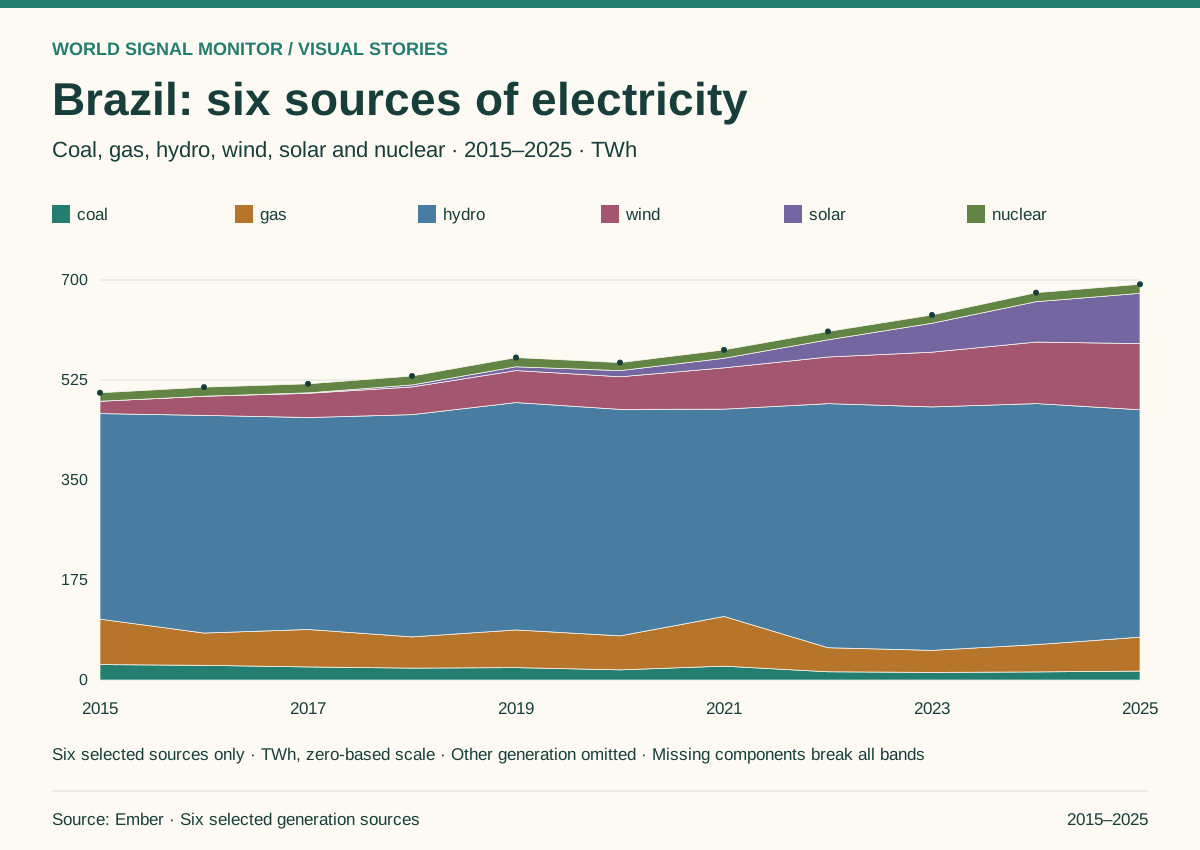
Brazil: six sources of electricity
Compare six non-overlapping generation categories through time using one zero-based TWh scale.
Explore the story →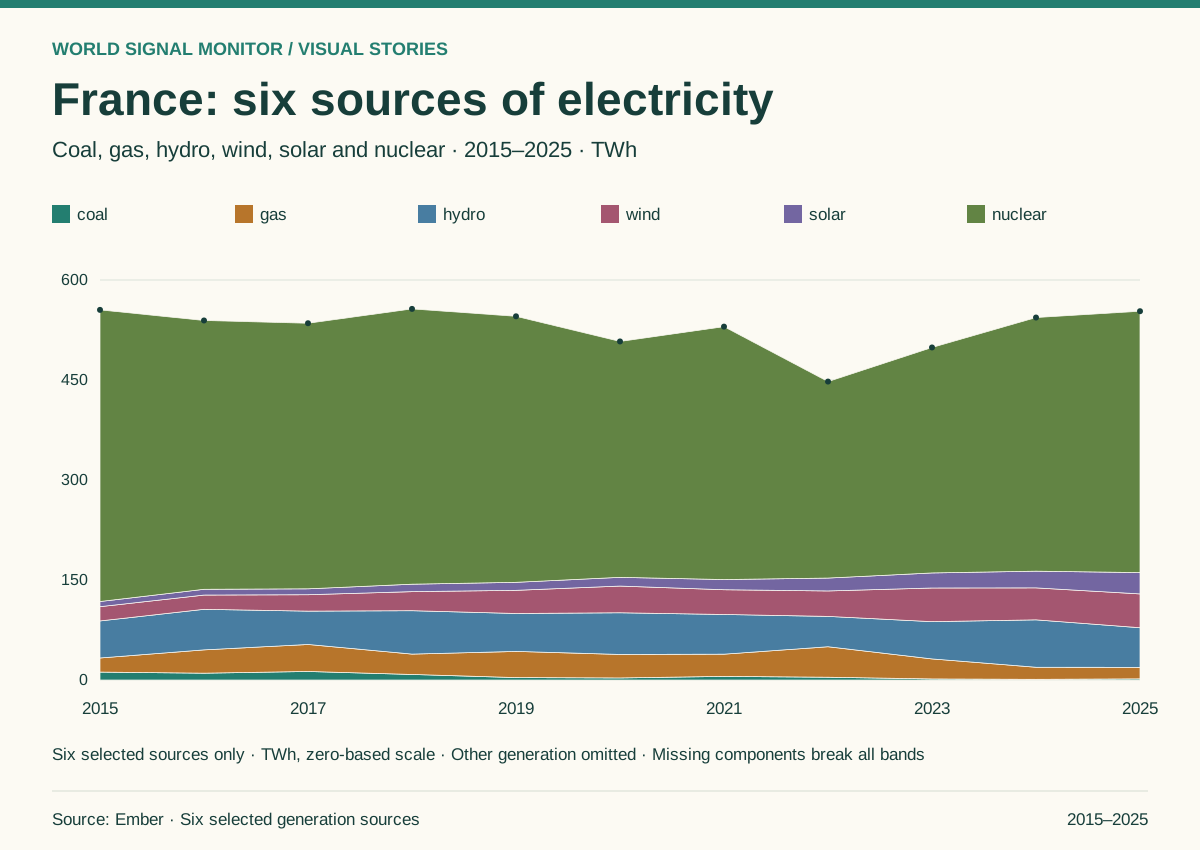
France: six sources of electricity
Compare six non-overlapping generation categories through time using one zero-based TWh scale.
Explore the story →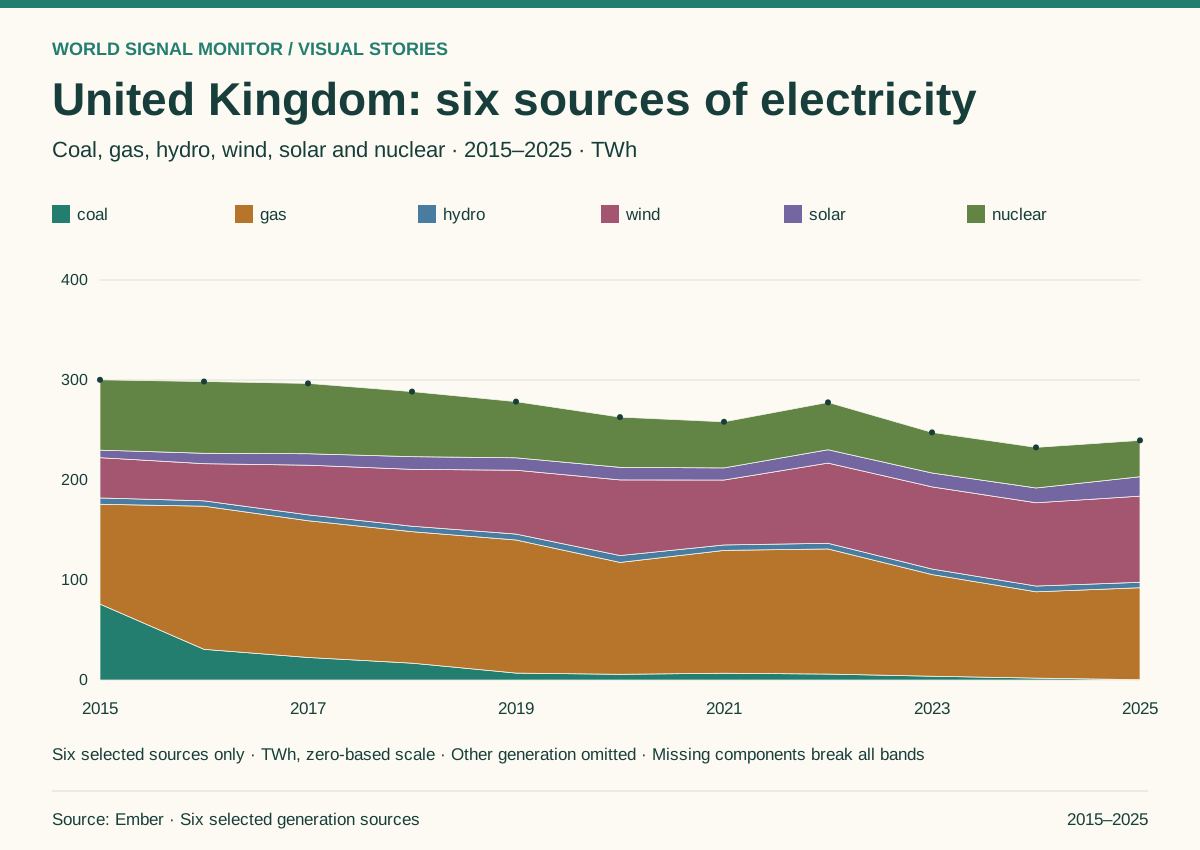
United Kingdom: six sources of electricity
Compare six non-overlapping generation categories through time using one zero-based TWh scale.
Explore the story →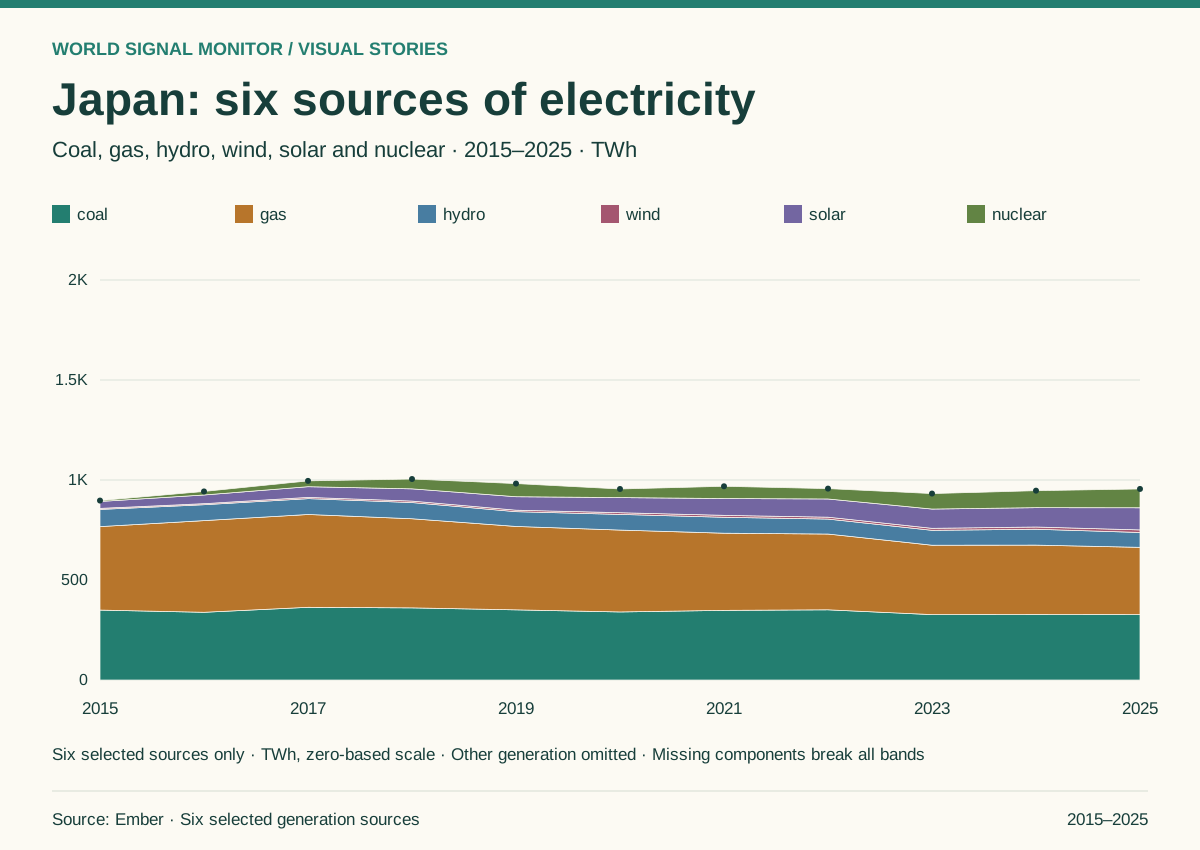
Japan: six sources of electricity
Compare six non-overlapping generation categories through time using one zero-based TWh scale.
Explore the story →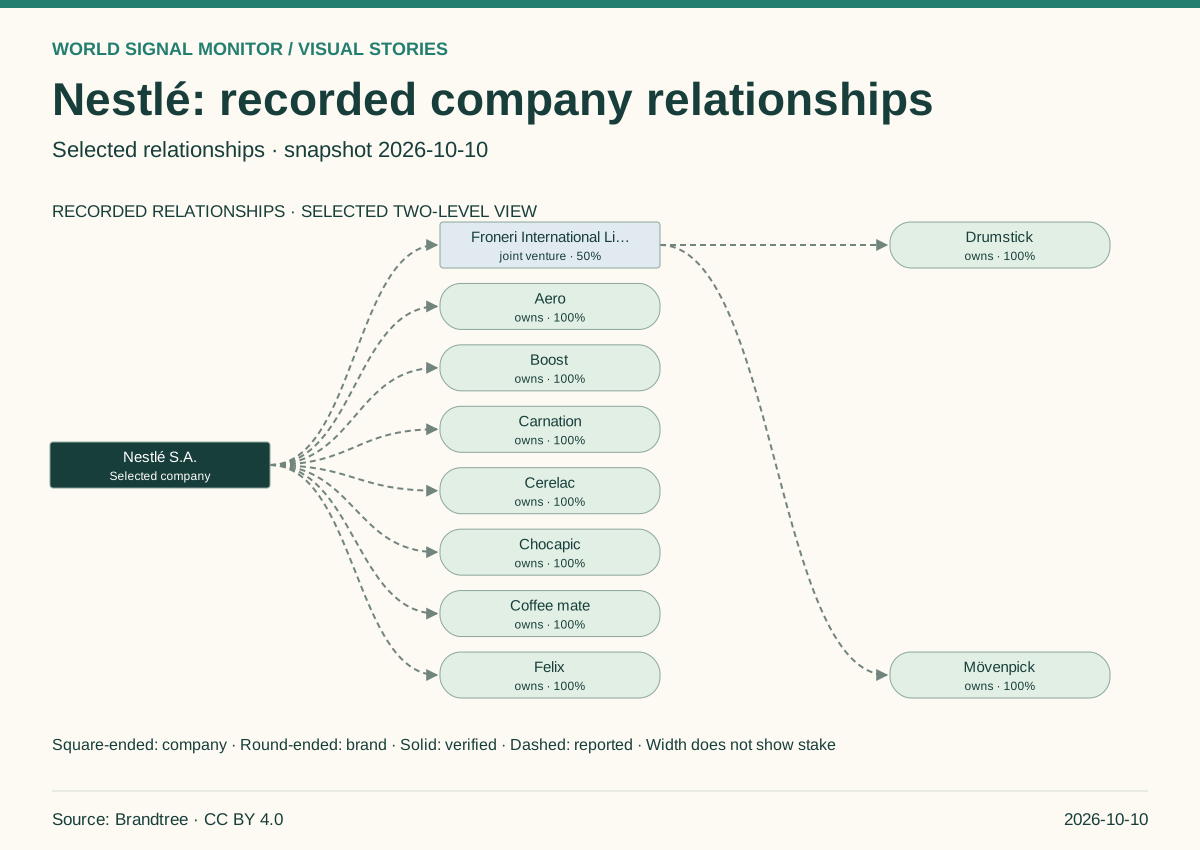
Nestlé: recorded company relationships
Inspect 10 recorded relationships around Nestlé, with company and brand nodes distinguished.
Explore the story →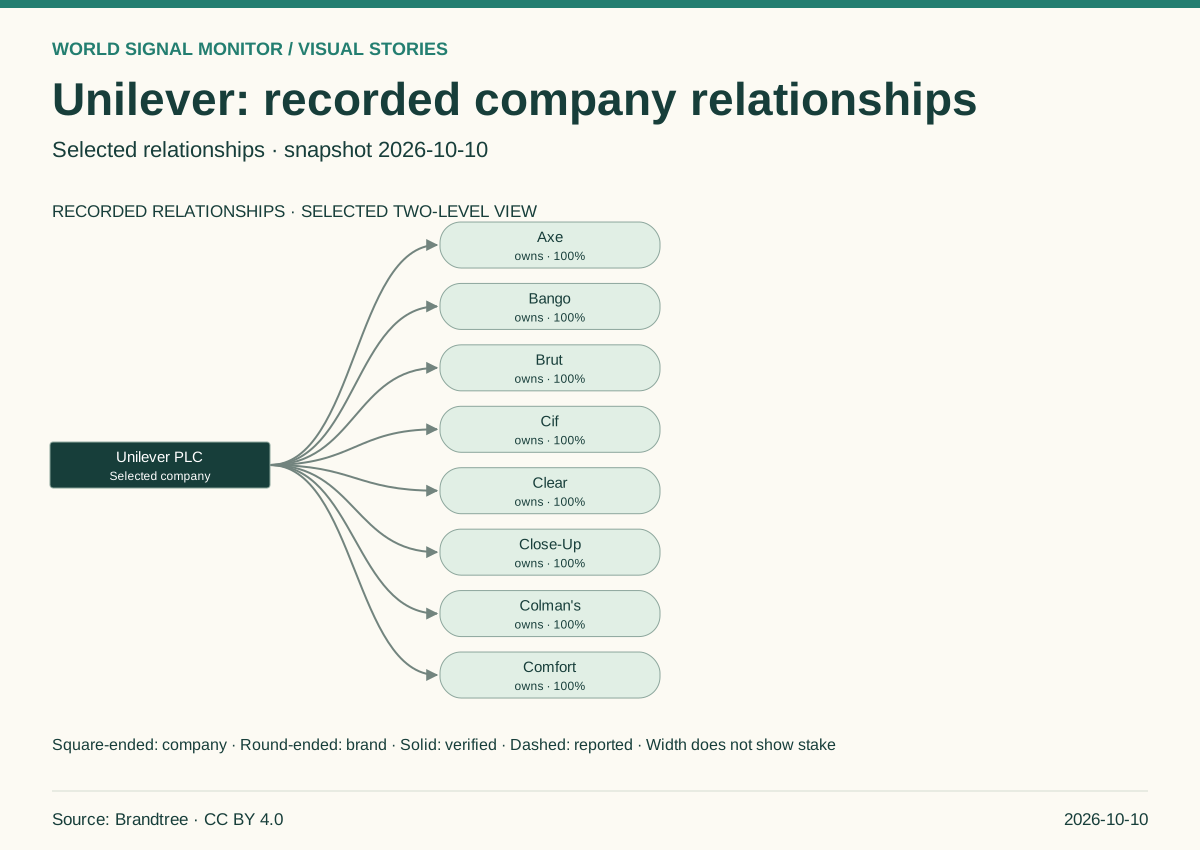
Unilever: recorded company relationships
Inspect 8 recorded relationships around Unilever, with company and brand nodes distinguished.
Explore the story →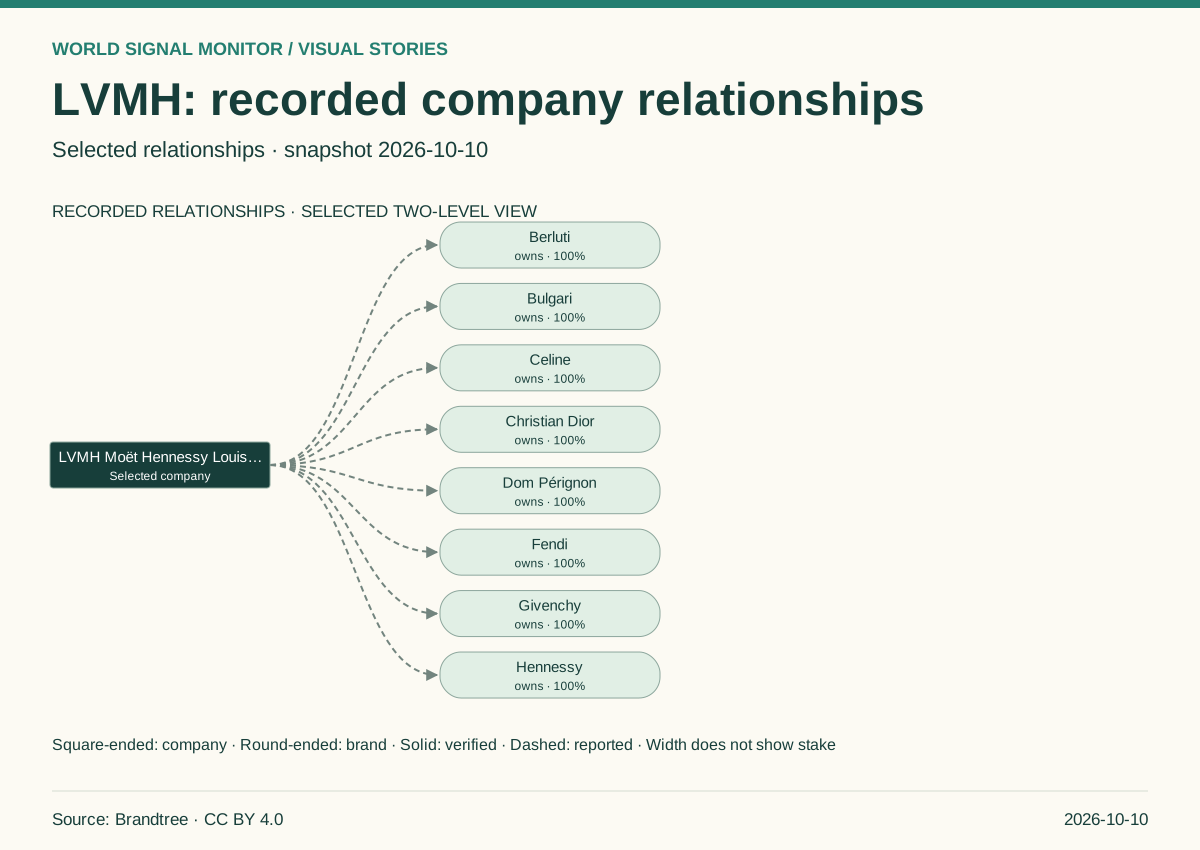
LVMH: recorded company relationships
Inspect 8 recorded relationships around LVMH, with company and brand nodes distinguished.
Explore the story →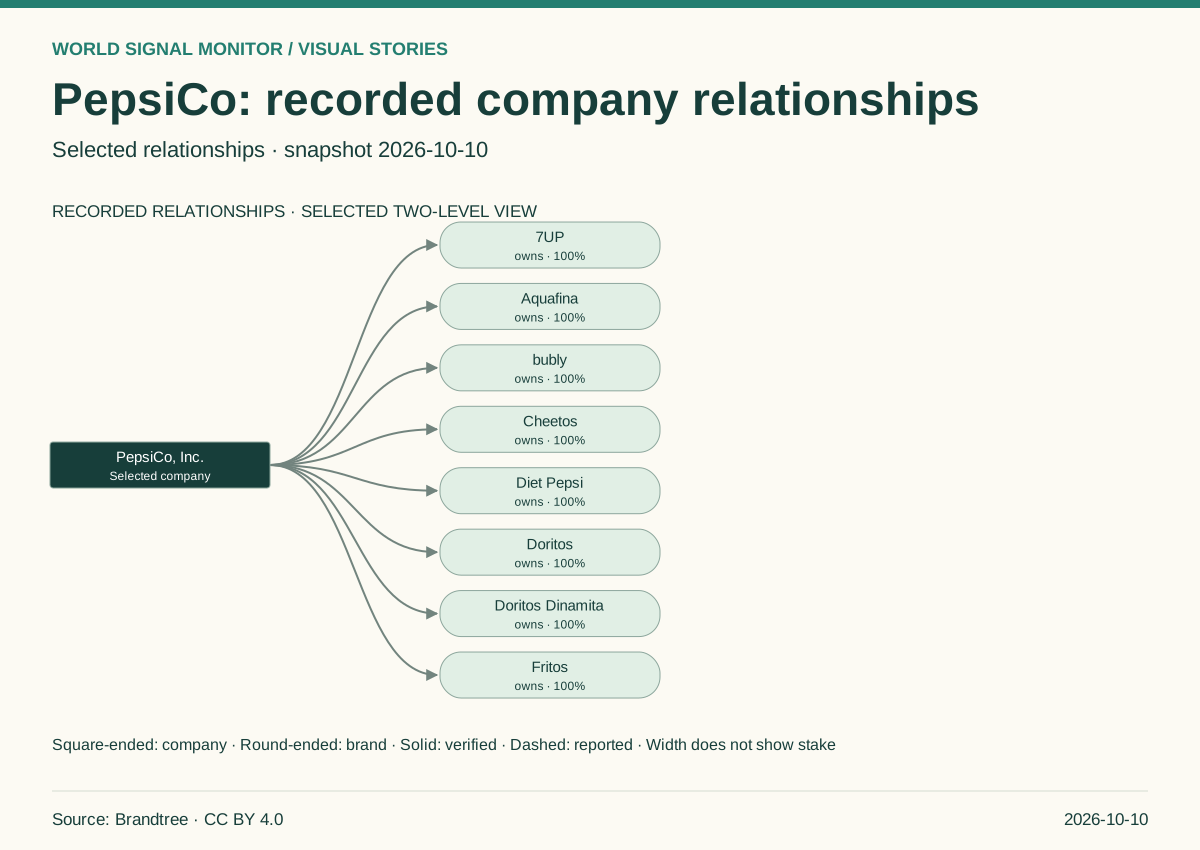
PepsiCo: recorded company relationships
Inspect 8 recorded relationships around PepsiCo, with company and brand nodes distinguished.
Explore the story →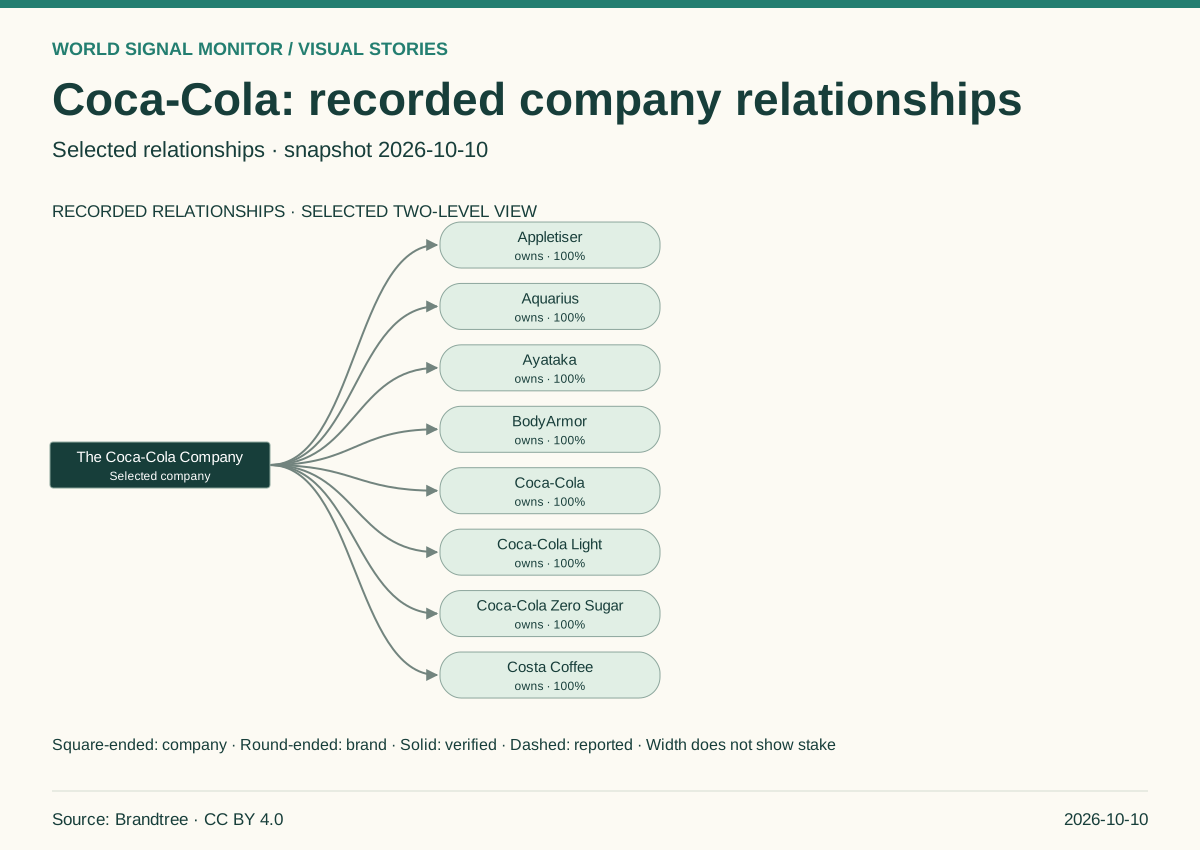
Coca-Cola: recorded company relationships
Inspect 8 recorded relationships around Coca-Cola, with company and brand nodes distinguished.
Explore the story →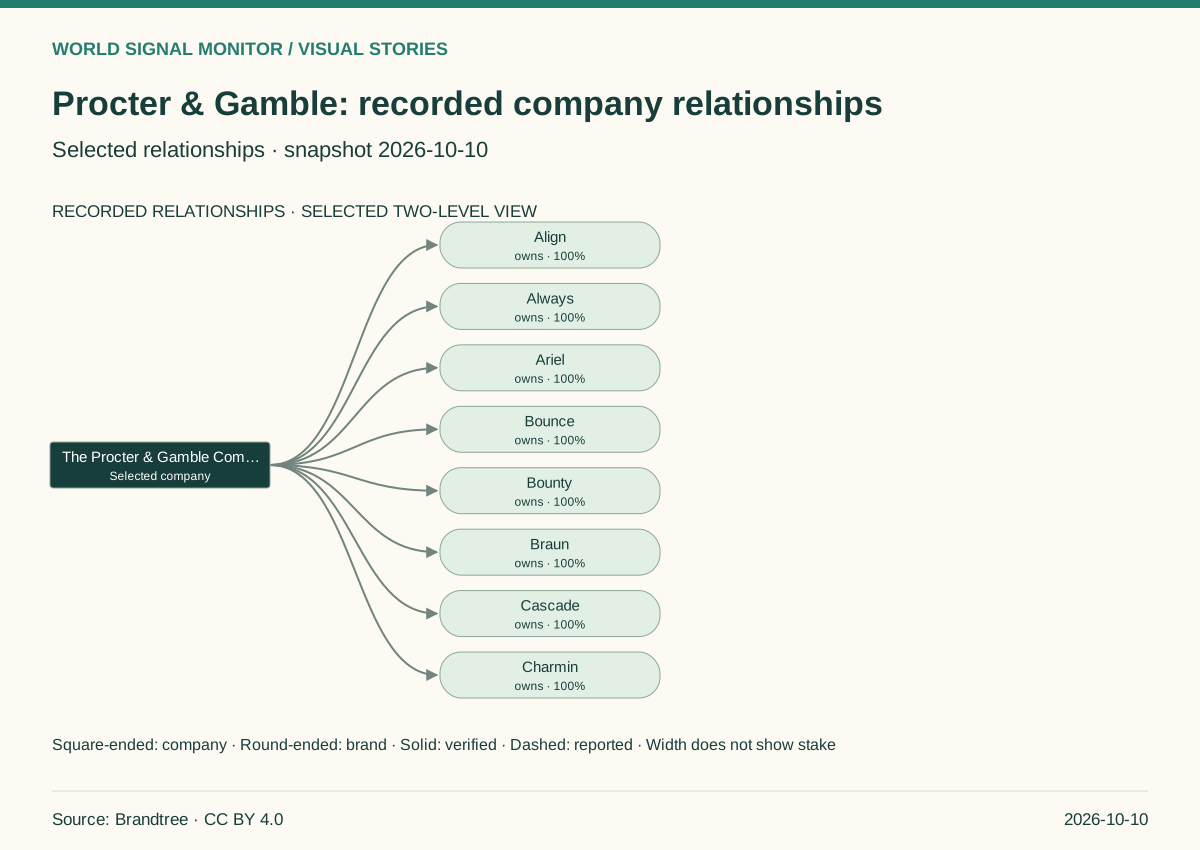
Procter & Gamble: recorded company relationships
Inspect 8 recorded relationships around Procter & Gamble, with company and brand nodes distinguished.
Explore the story →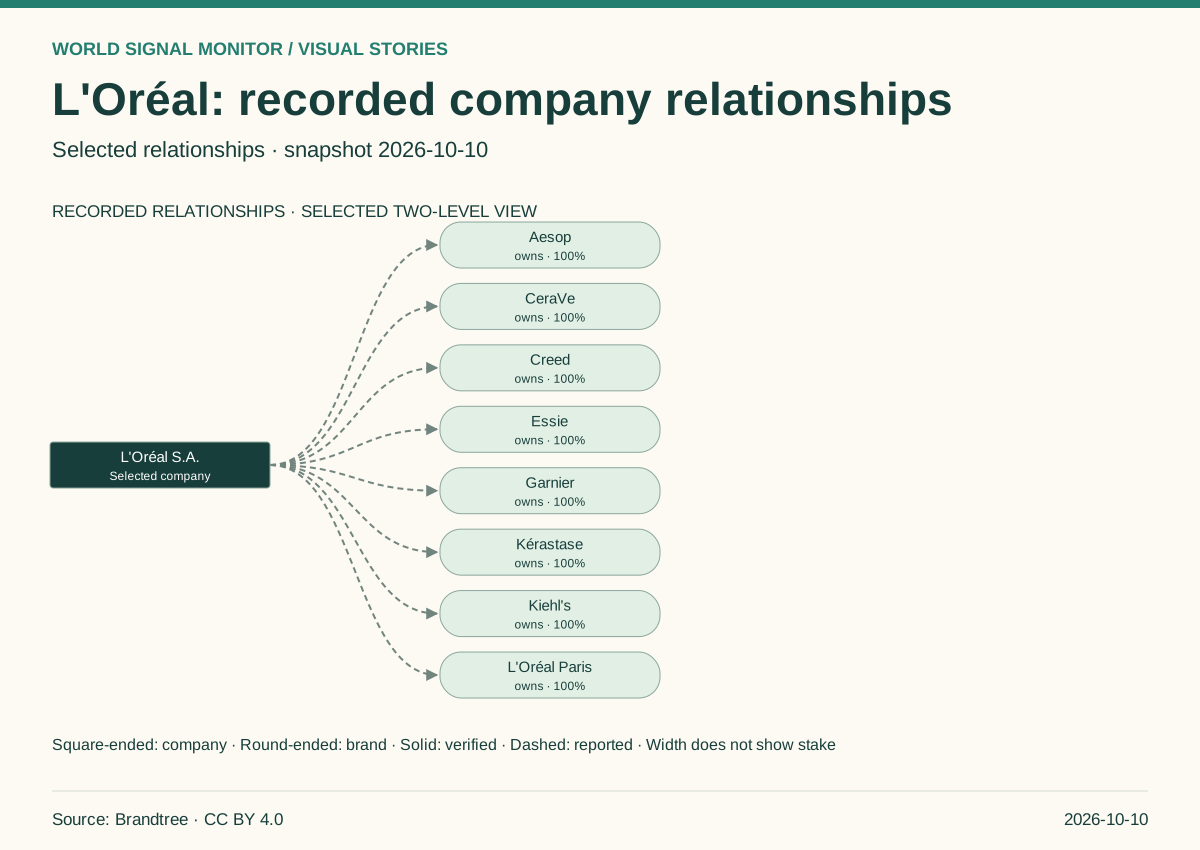
L'Oréal: recorded company relationships
Inspect 8 recorded relationships around L'Oréal, with company and brand nodes distinguished.
Explore the story →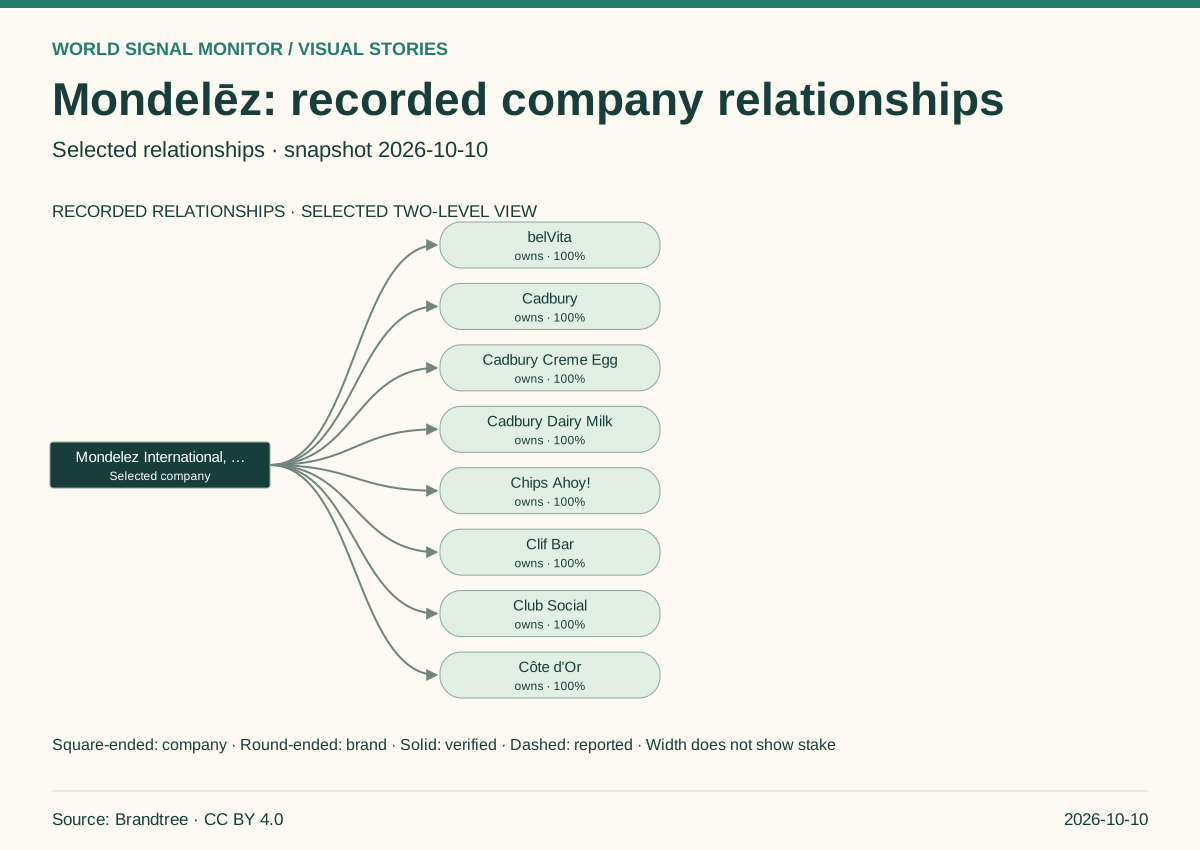
Mondelēz: recorded company relationships
Inspect 8 recorded relationships around Mondelēz, with company and brand nodes distinguished.
Explore the story →No diagrams match this search. Try another topic or search term.